
Patrick DeVivo

MergeStat's mission is to make it possible to query anything involved in building & shipping software with SQL. Recently, we had a user looking to query YAML files across their git repos, wanting to extract and aggregate values from config files.

We thought for a bit, and came up with a solution. An odd one, but one that works surprisingly well ๐Ÿ˜ƒ.

How it worksโ€‹

  1. Ensure the PLV8 extension is installed in Postgres. This allows us to run JavaScript in the database.
  2. Create a user-defined function plv8_yaml_to_json() that uses an existing JavaScript YAML parser, to convert YAML strings into JSON.
  3. Write and execute SQL that uses the new function and the native Postgres JSON operators to query what you're looking for ๐ŸŽ‰.

Here it is altogether!

What can we query?โ€‹

Well, to showcase this, let's look at a git repo with a lot of YAML. One good example is the public bitnami/charts repo, which is a collection of Helm Charts for popular OSS applications to run on Kubernetes.

List all Helm charts (and their annotated category)โ€‹

WITH bitnami_charts AS (
SELECT path, plv8_yaml_to_json(contents) AS chart FROM git_files
JOIN repos ON git_files.repo_id = repos.id
WHERE repo = 'https://github.com/bitnami/charts'
AND path LIKE 'bitnami/%/Chart.yaml'
)
SELECT
chart->>'name' AS chart_name,
chart->>'description' AS chart_description,
chart->'annotations'->>'category' AS category
FROM bitnami_charts
chart_namechart_descriptioncategory
airflowApache Airflow is a tool to express and execute workflows as directed acyclic graphs (DAGs). It includes utilities to schedule tasks, monitor task progress and handle task dependencies.WorkFlow
apacheApache HTTP Server is an open-source HTTP server. The goal of this project is to provide a secure, efficient and extensible server that provides HTTP services in sync with the current HTTP standards.Infrastructure
appsmithAppsmith is an open source platform for building and maintaining internal tools, such as custom dashboards, admin panels or CRUD apps.CMS
argo-cdArgo CD is a continuous delivery tool for Kubernetes based on GitOps.Infrastructure
argo-workflowsArgo Workflows is meant to orchestrate Kubernetes jobs in parallel. It uses DAG and step-based workflowsInfrastructure
...

How many charts are in each category?โ€‹

WITH bitnami_charts AS (
SELECT path, plv8_yaml_to_json(contents) AS chart FROM git_files
JOIN repos ON git_files.repo_id = repos.id
WHERE repo = 'https://github.com/bitnami/charts'
AND path LIKE 'bitnami/%/Chart.yaml'
)
SELECT
count(*),
chart->'annotations'->>'category' AS category
FROM bitnami_charts
GROUP BY category
ORDER BY count(*) DESC

Bitnami chart count by category

Hopefully that gives you a sense of what's possible chaining together YAML, MergeStat, JavaScript, and Postgres!

Join our Slack

If you found this interesting, hop in our community Slack! We're always happy to chat about MergeStat there ๐ŸŽ‰.

Patrick DeVivo

In software, as maybe in life, change is as inevitable as death and taxes ๐Ÿ™‚. SCM/VCS tools like Git, which manage code changes, are fundamental to anyone developing code. If DORA is your thing, you'll also know that "deployment frequency" is a key metric (as a proxy for measuring development velocity over time).

In our work on MergeStat, we've often wanted to understand how frequently we ship code. In particular, we want to ensure that our work makes it's way into the hands of our users on a regular basis. Luckily, we've been able to use MergeStat to keep tabs on our release frequency. We've built an internal dashboard using Grafana to support our activities around managing our releases:

Screenshot of Grafana dashboard tracking our release frequency

This dashboard, and the queries powering it, allow us to answer some questions quickly:

  • How long has it been since our last release?
  • On average, how frequently do we typically release new versions? (Over the past 90 days)
  • How are we doing relative to our own benchmarks of a "healthy" release cadence?
    • Where time-between-releases under 1 week is healthy โœ…
    • Between 1 and 2 weeks is a warning โ—
    • More than 2 weeks is an alert ๐Ÿšจ

And here are some of the SQL queries powering these views:

-- retrieve the days since the last MergeStat release
SELECT name, committer_when, ROUND(EXTRACT(EPOCH FROM now() - committer_when)/(86400), 2) AS days_since_last_release
FROM git_tags
JOIN repos ON git_tags.repo_id = repos.id
JOIN git_commits ON git_tags.tag_commit_hash = git_commits.hash
WHERE repo = 'https://github.com/mergestat/mergestat'
ORDER BY committer_when DESC LIMIT 1
-- retrieve the avg (mean) time between new releases, over the last 90 days
WITH tags AS (
SELECT
name, committer_when,
committer_when - LAG(committer_when) OVER (ORDER BY committer_when) AS since_prev_tag
FROM git_tags
JOIN repos ON git_tags.repo_id = repos.id
JOIN git_commits ON git_tags.tag_commit_hash = git_commits.hash
WHERE repo = 'https://github.com/mergestat/mergestat'
AND author_when > now() - '90 days'::interval
ORDER BY committer_when ASC
)
SELECT ROUND(EXTRACT(EPOCH FROM avg(since_prev_tag))/(86400), 2) AS mean_time_between_releases FROM tags

What comes next?

  • We'd like to alert to our Slack when it's been too long since a release
  • We'd like a regular push to our Slack for a regular update on how our release cadence is
Join our Slack

If you found this interesting or would like a similar view of your release cadence, hop in our community Slack! We're always happy to chat about MergeStat there ๐ŸŽ‰.

Peter Freiberg
Guest Post

This is a guest post by Peter Freiberg, a DevSecOps and application security consultant based in Melbourne, Australia.

I am a consultant who specialises in Application Security and DevSecOps. I've built teams and capabilities for organisations around Penetration Testing (ethical hacking), Secure Code Reviews, DevSecOps, Security Test Automation, Security Development Lifecycle and training.

Identifying Open-Source Library Risk Using MergeStat (Part 1)

One topic that arises frequently in my work is understanding what open-source code is in use in an organisation, and where that organisation may have vulnerabilities. Moreover, how do we ensure consistent visibility into our open-source risk profile over time?

Large organisations often have a lot of code, a lot of developers, and a lot of dependencies. This can make it feel like quite a daunting task, and itโ€™s often difficult to know where to begin. The reality, however, is that with a couple of open-source tools, almost every company can easily get accurate information on a great many topics if they know where to look and how to use their data. Thereโ€™s so much useful data within Git, but not many people are using it today.

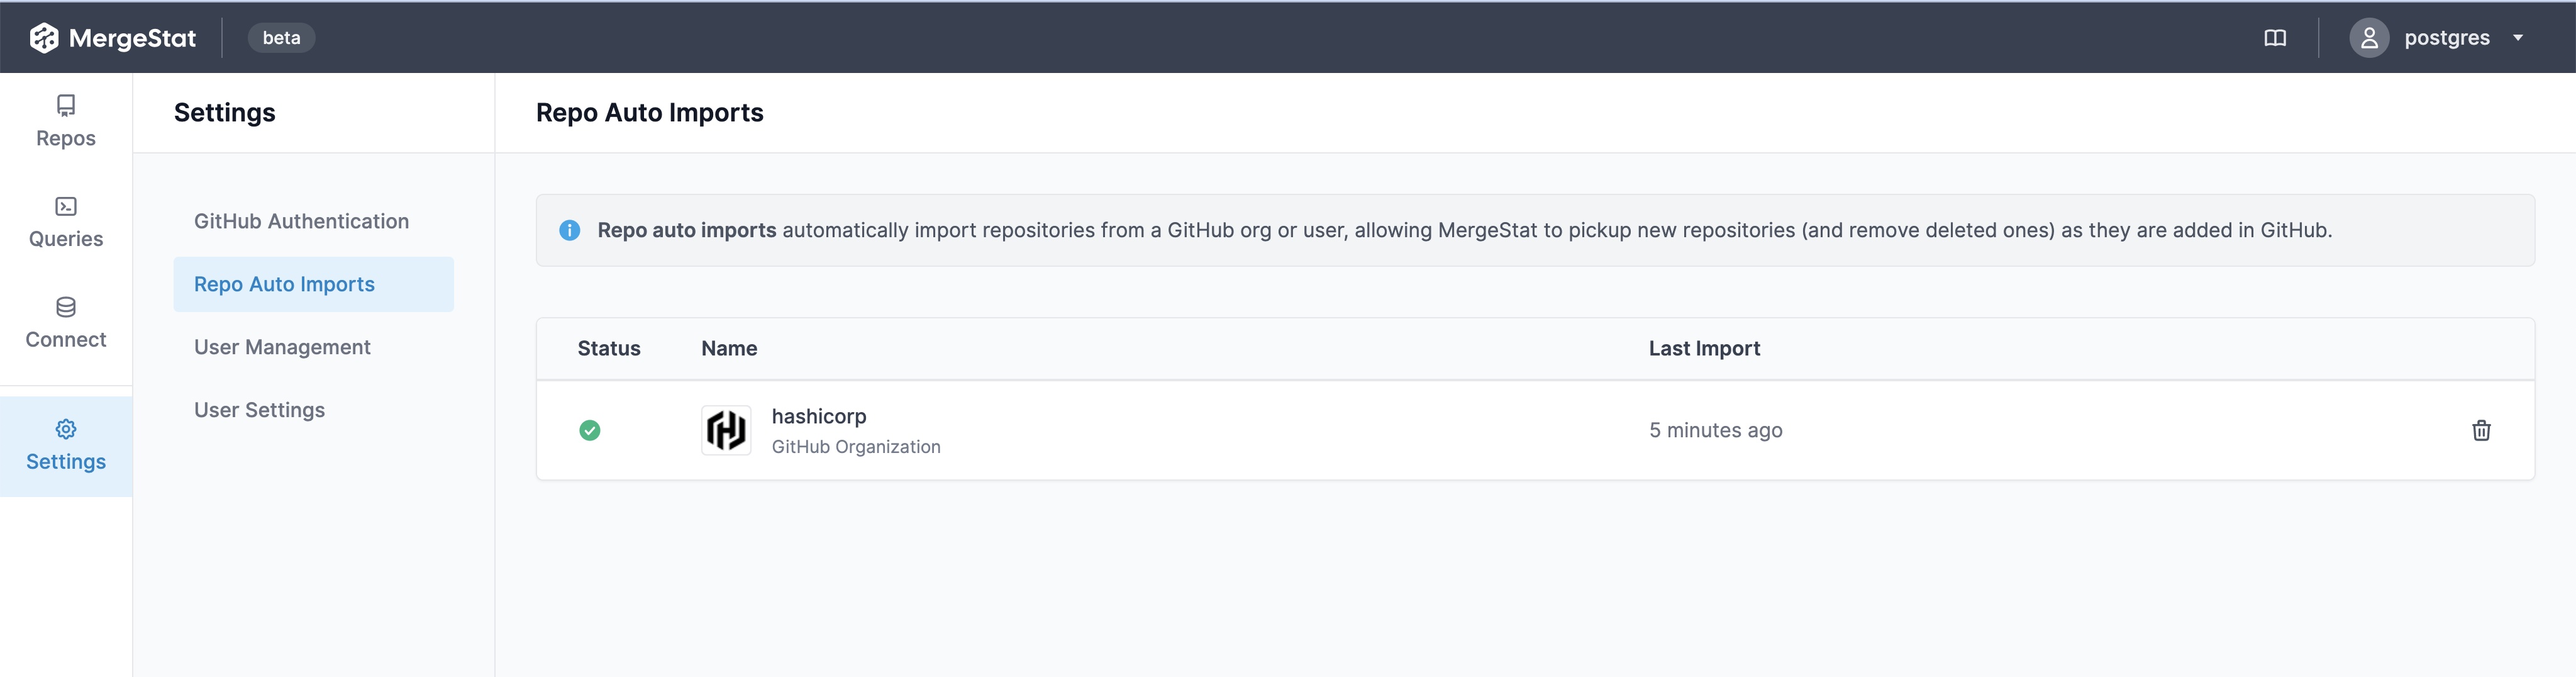
MergeStat is one such tool that can help, and here weโ€™ll showcase some queries that can assess open-source library risk and identify the general development landscape across code in an organisation. MergeStat allows you to query all your Git repositories using SQL, to start asking questions like:

  • Where in our organisation do we use maven (pom.xml) or other package managers of interest?
  • Iโ€™ve found a security issue in our dependencies, which developer modified this last so I can collaborate on remediation?
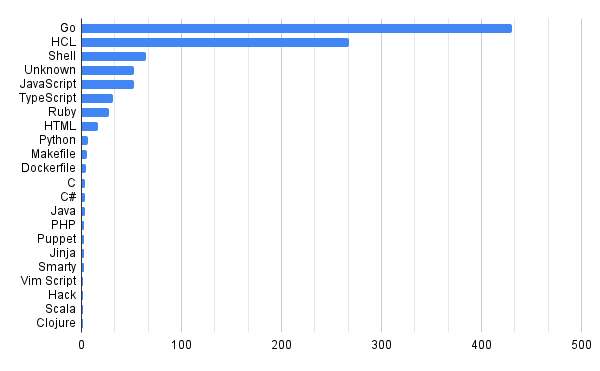
  • Whatโ€™s our technology and language landscape?

Being able to query code ourselves saves a lot of time, the data is the data, itโ€™s actually whatโ€™s happened versus surveys, emails and spreadsheets that take weeks to collate and analyse.

I think itโ€™s really useful for AppSec or DevSecOps people to be able to query and analyse code at scale, and then proactively reach out to developers.

Weโ€™re going to explore a few use cases for querying an organisationโ€™s code bases, with a little help from automation and some data augmentation, to identify some specific areas of risk.

Show me XYZ open source package manager files, so I can look for known vulnerabilitiesโ€‹

In this example, weโ€™re simply going to look for known package manager file types, in this case maven.

-- Find all maven (pom.xml) files across the enterprise 
SELECT repo, path
FROM git_files
INNER JOIN repos ON git_files.repo_id = repos.id
WHERE path LIKE '%pom.xml%'

From this generated list of files, we can do our own analysis. If youโ€™re already using an SCA tool for your organisation you can also run your own analysis. Keep in mind that having a security tool for your organisation, doesnโ€™t mean everyone is using it (yet).

If we find a potential vulnerability in a file, we can also query who the last author (developer) was and who committed it to the repo again using another query:

SELECT author_email, author_when, committer_email, committer_when
FROM git_commits
JOIN git_commit_stats ON git_commits.hash = git_commit_stats.commit_hash
JOIN repos ON git_commits.repo_id = repos.id
WHERE file_path = 'PATH/TO/THE-FILE.extenstion' AND
repo = 'https://github.com/YOUR_ORG/REPO'
LIMIT 1

While the last developer or committer may not have added the library which has the issue, at least they have looked at the file recently and in a good position to collaborate with us.

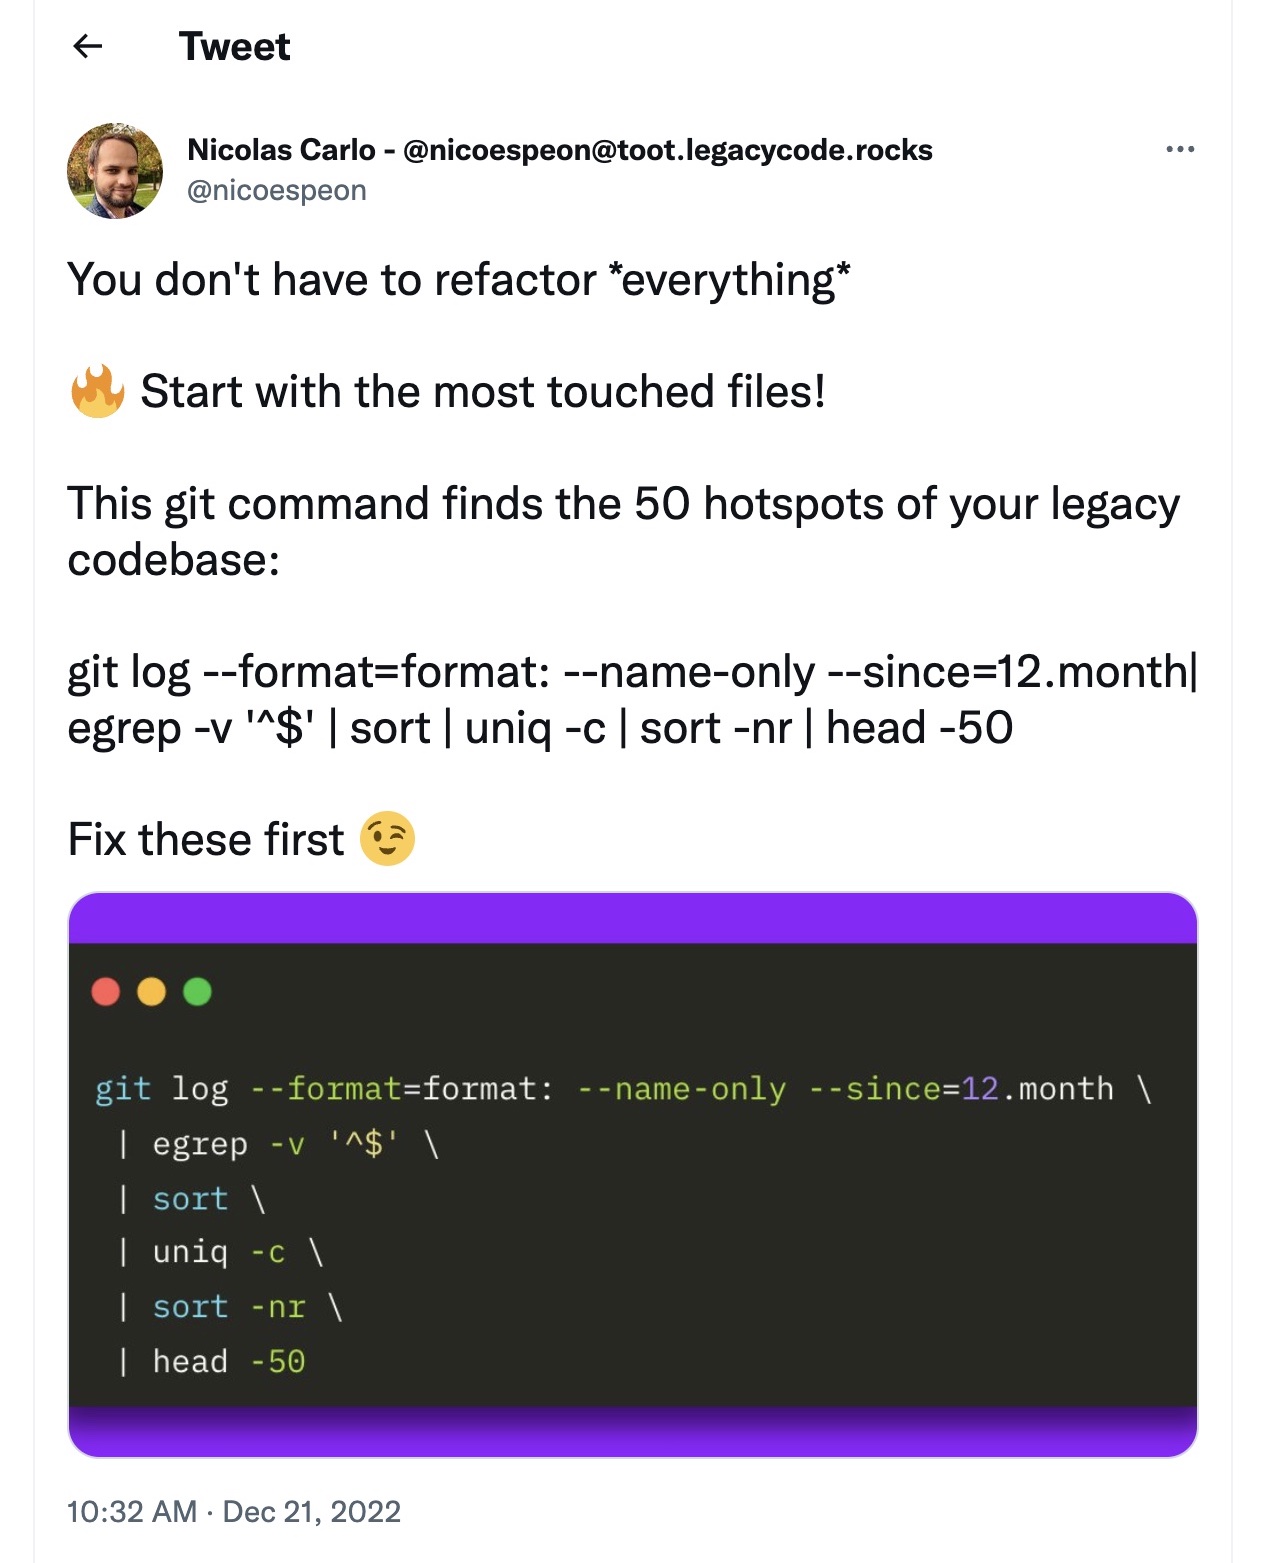
Across all our Git repos, show the most frequently used 3rd party dependenciesโ€‹

One of the first and most fundamental challenges is simply understanding what 3rd party, open-source code a company uses. This is often difficult to aggregate across many code bases and teams.

It can be trivial to access this information in a single repo, but across many (hundreds or even thousands), it can be much more difficult, at least without some automation (or a tool like MergeStat).

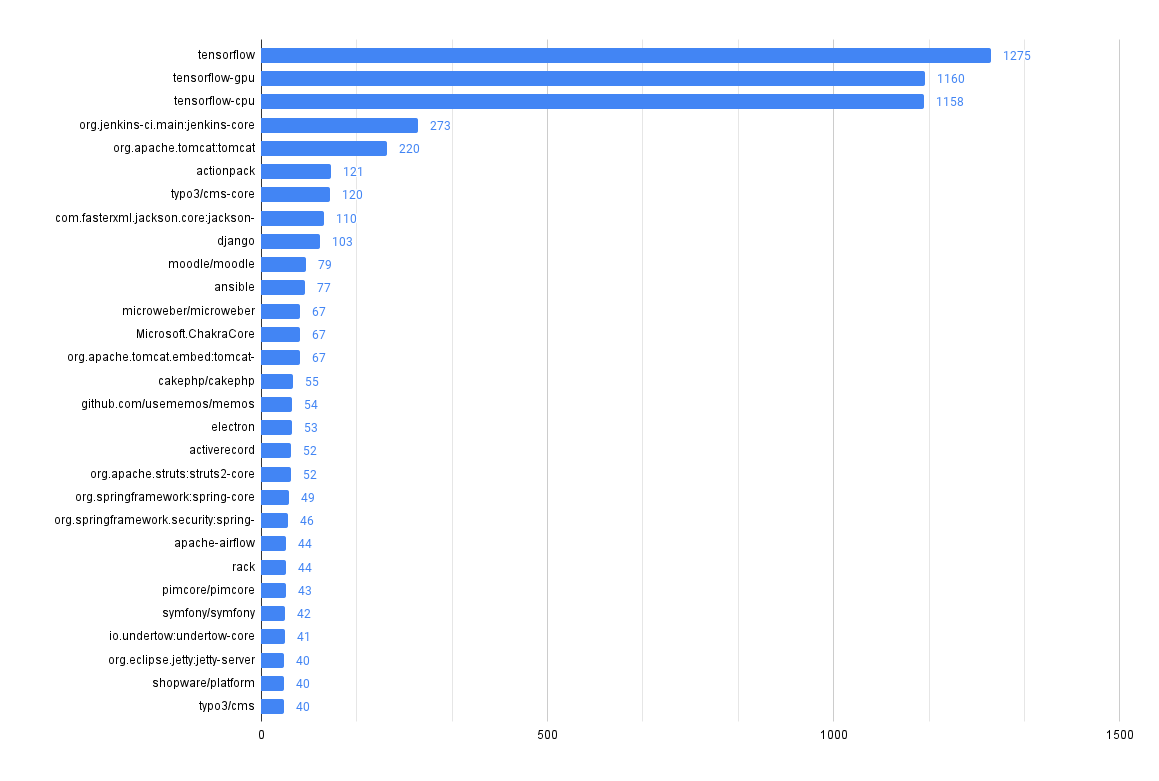
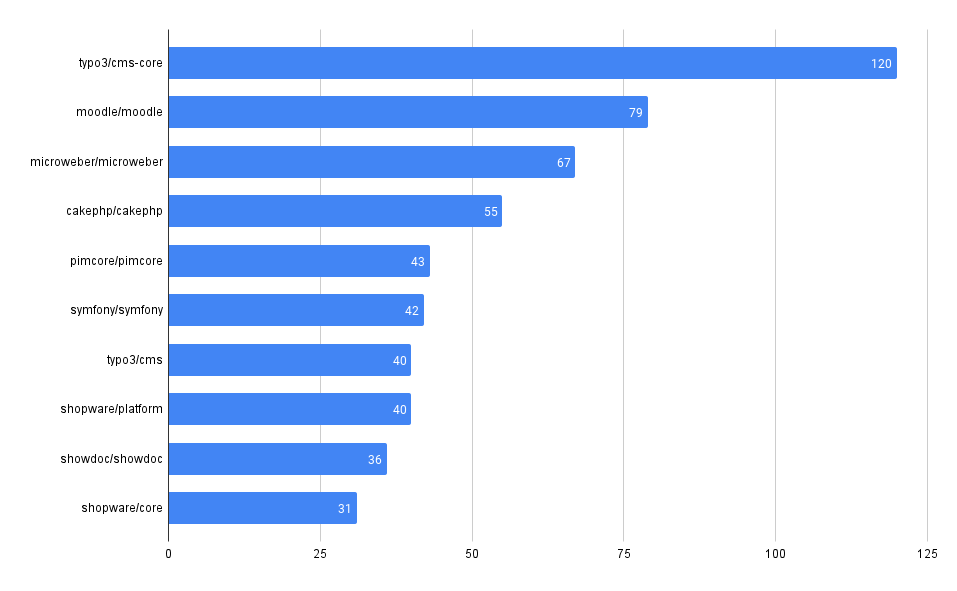
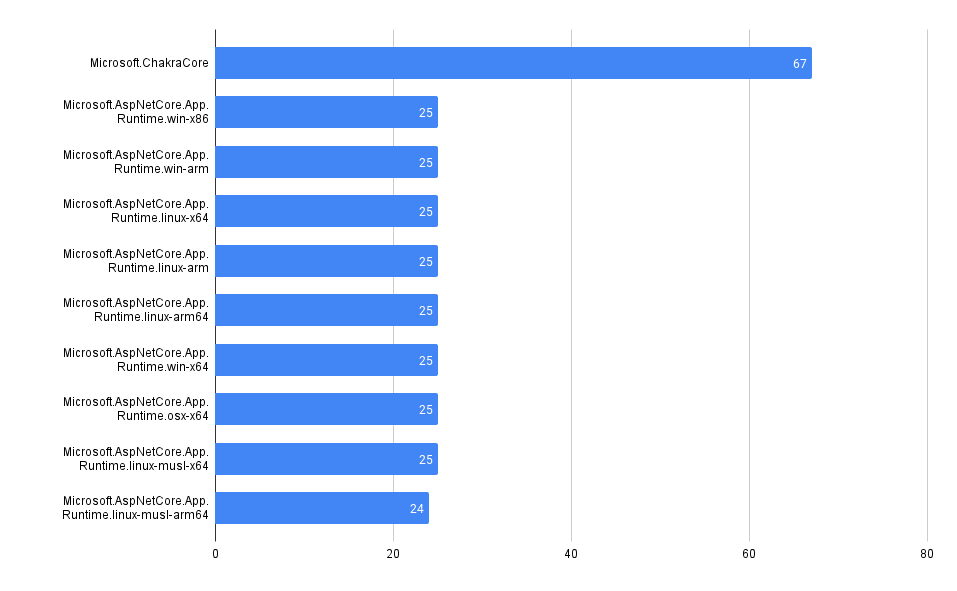
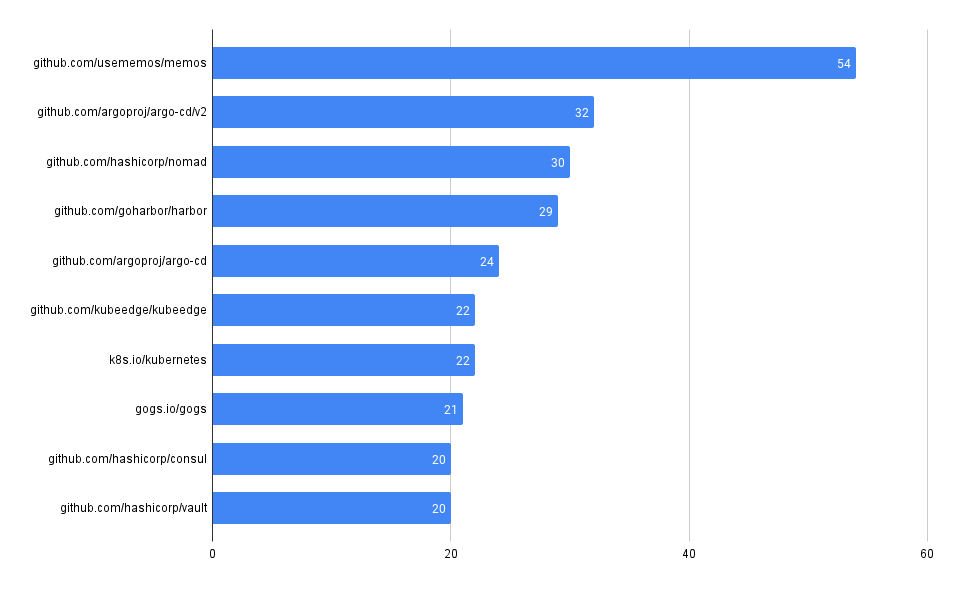
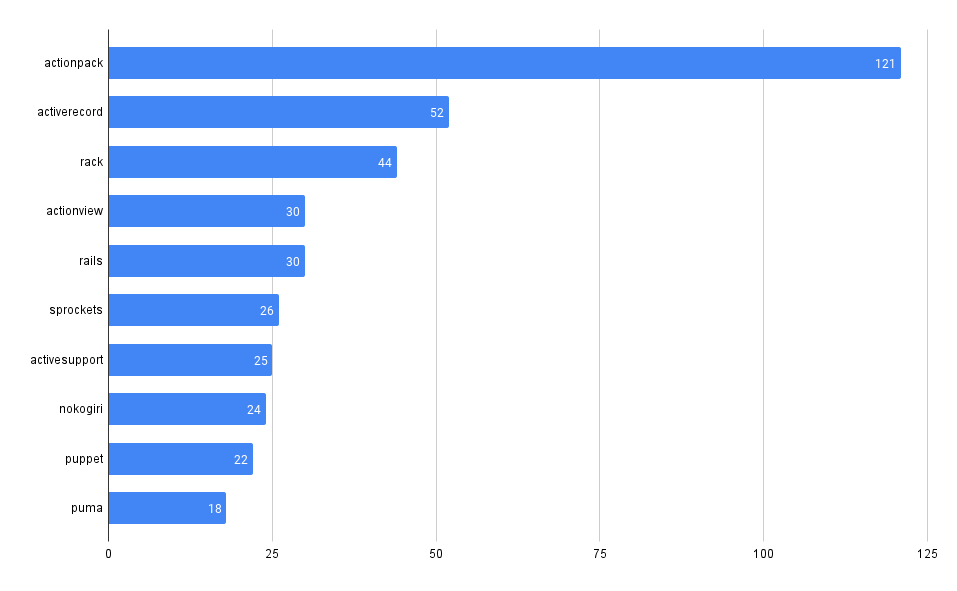
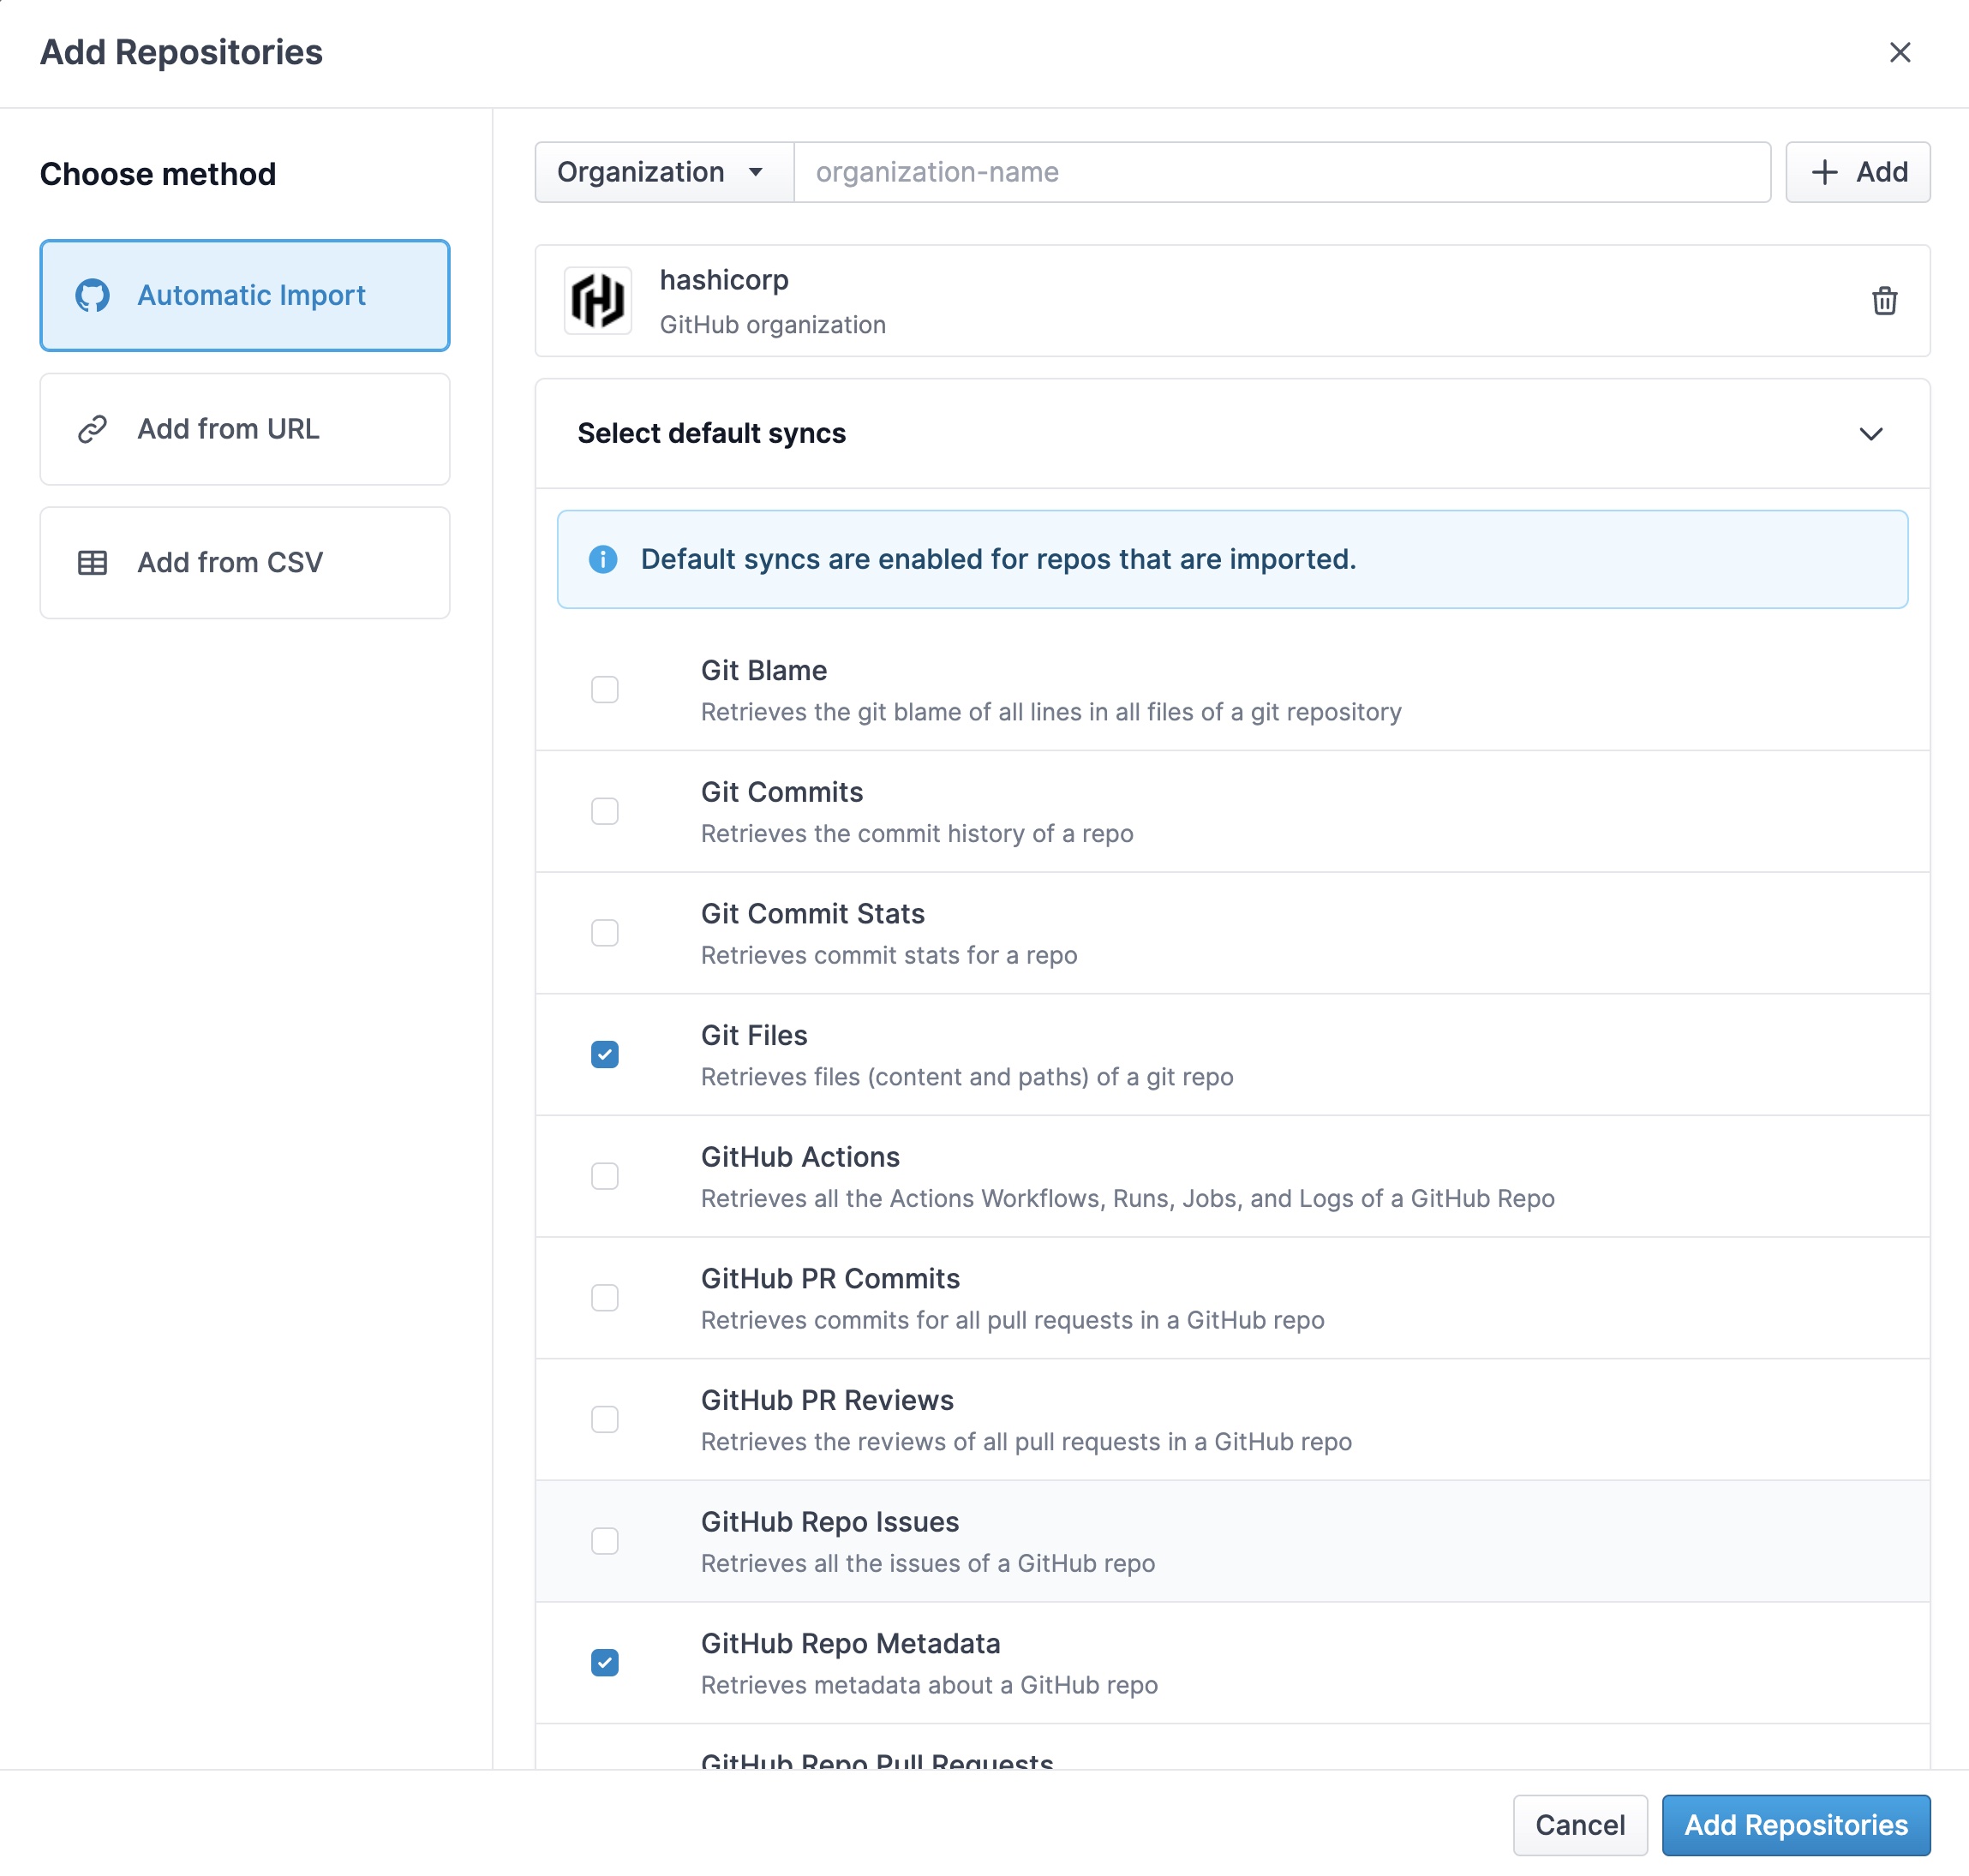
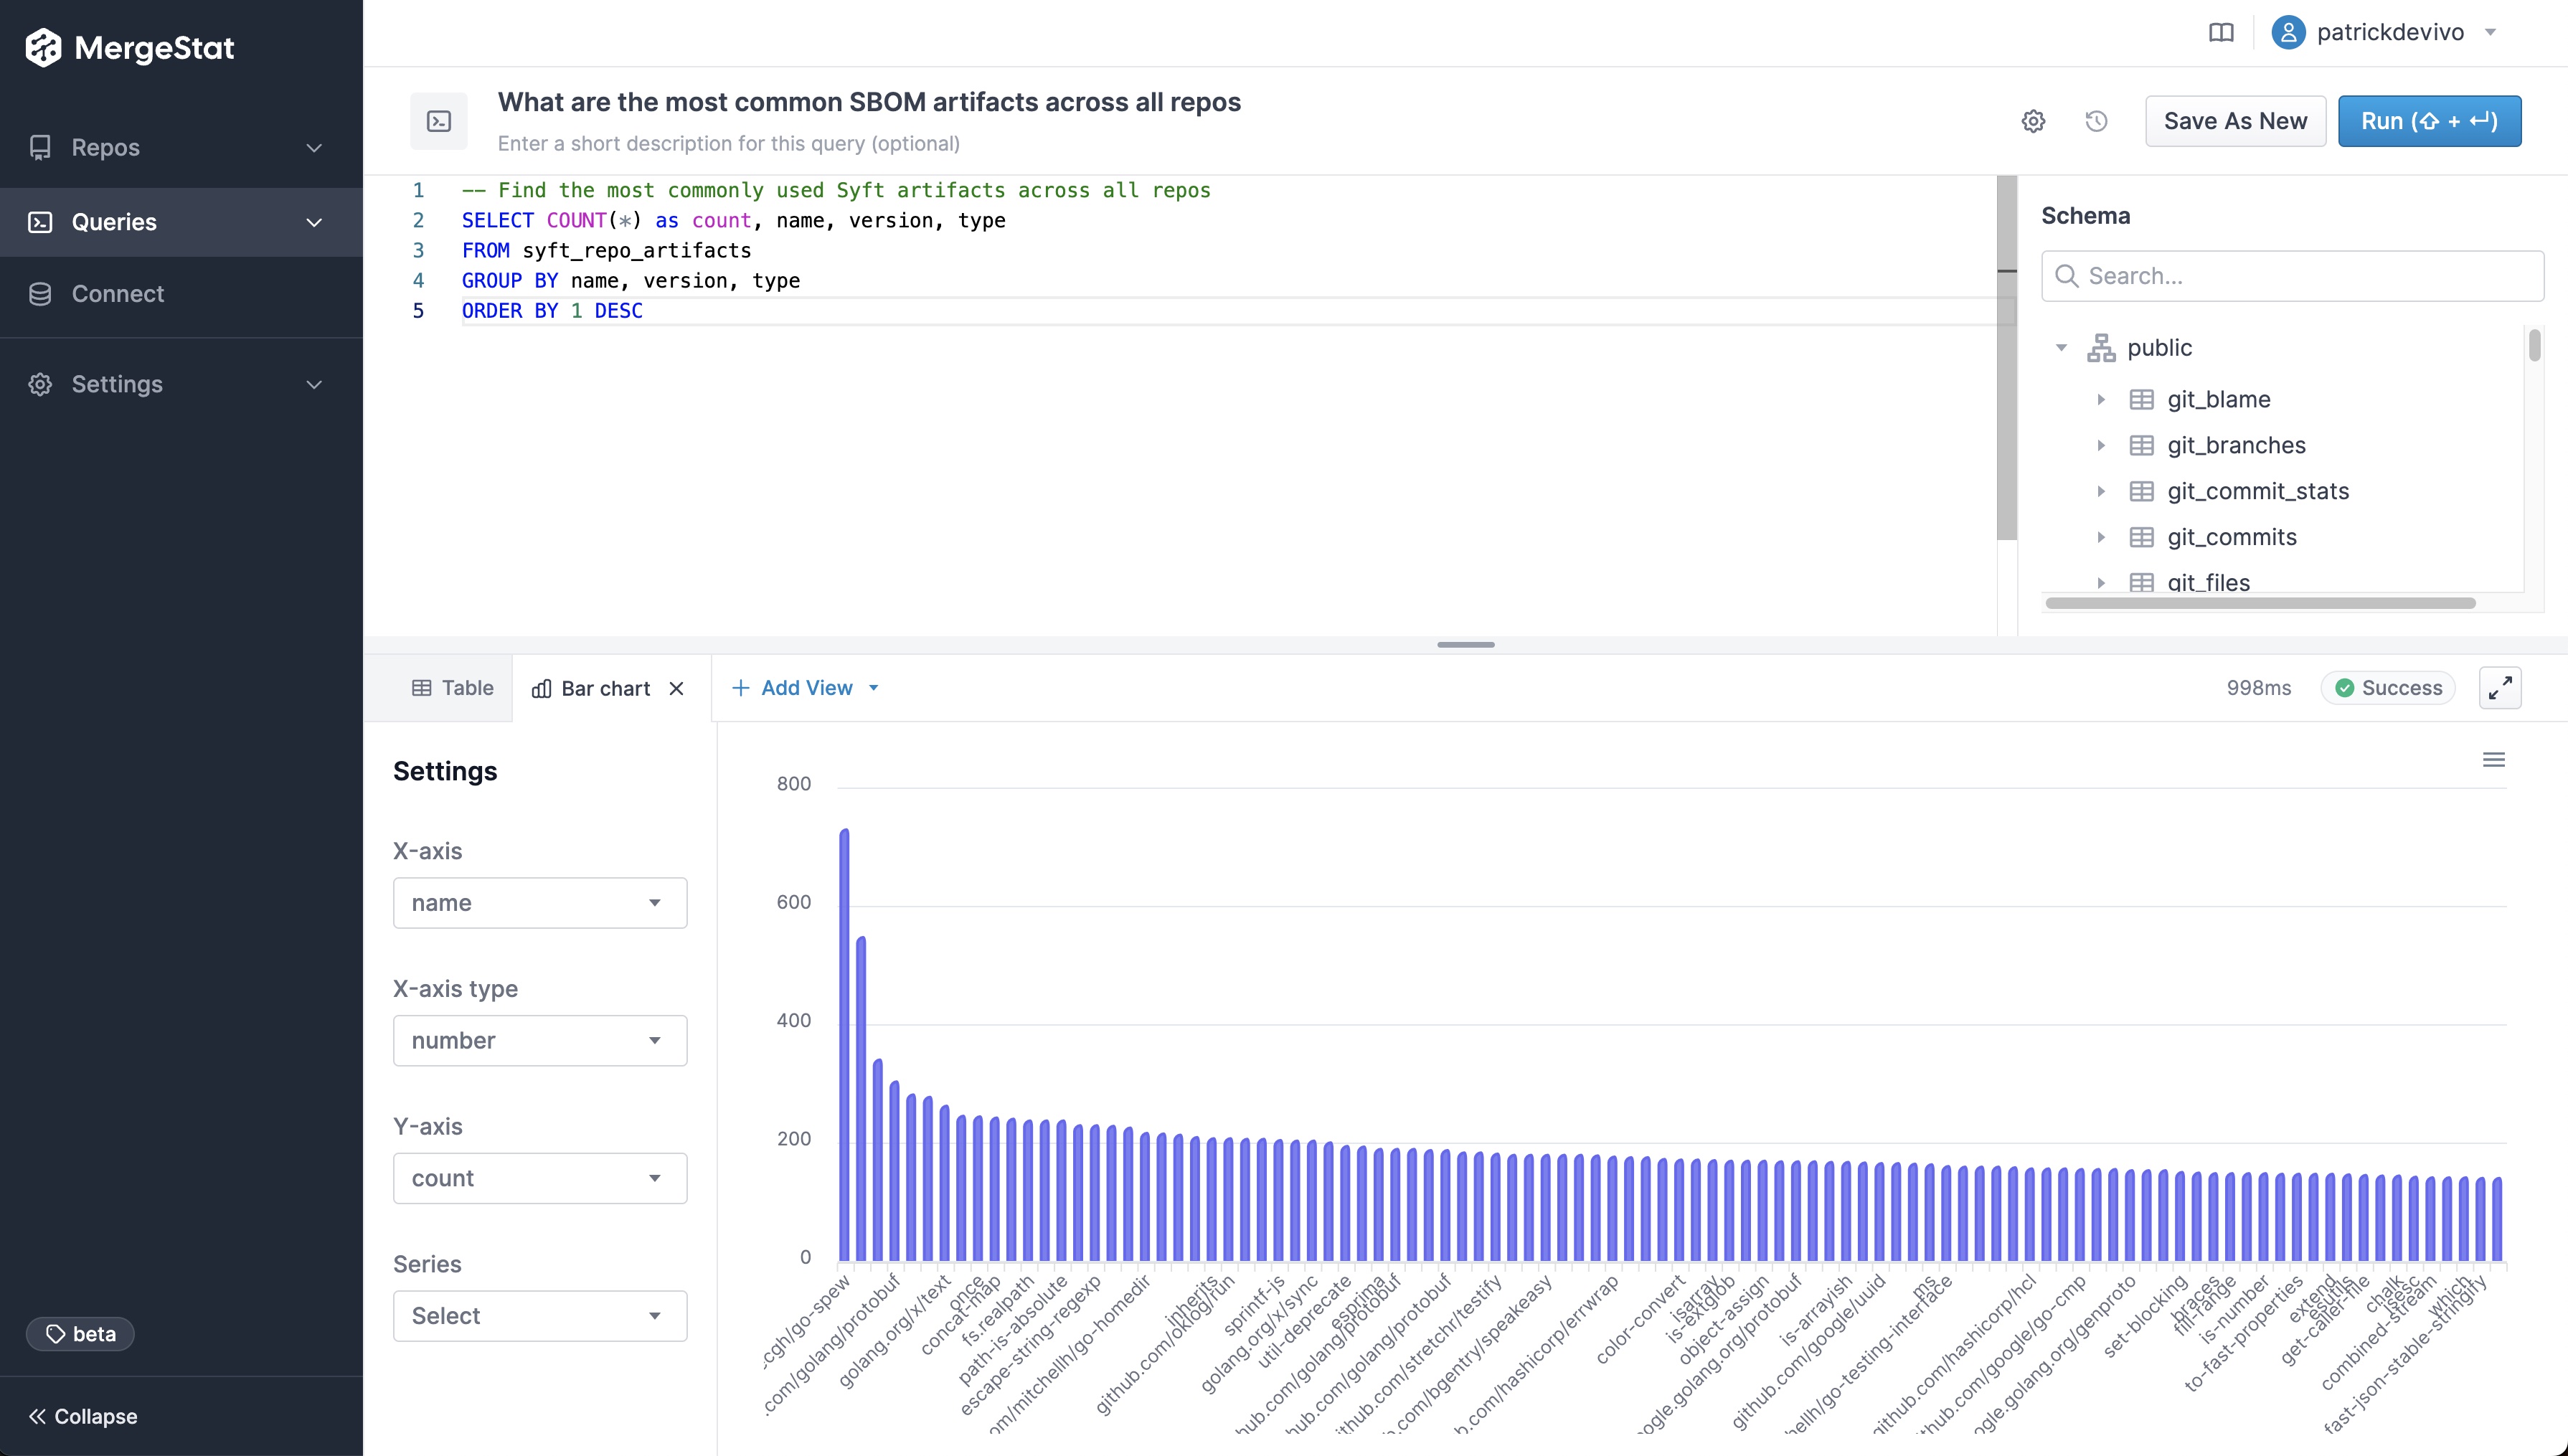
MergeStat is able to run open-source SBOM generators on all the Git repositories in an organisation, and store their output in PostgreSQL. In this example, Syft is used to generate and store SBOMs for supported package managers, allowing us to execute a query like this one:

-- Find the most commonly used Syft artifacts across all repos
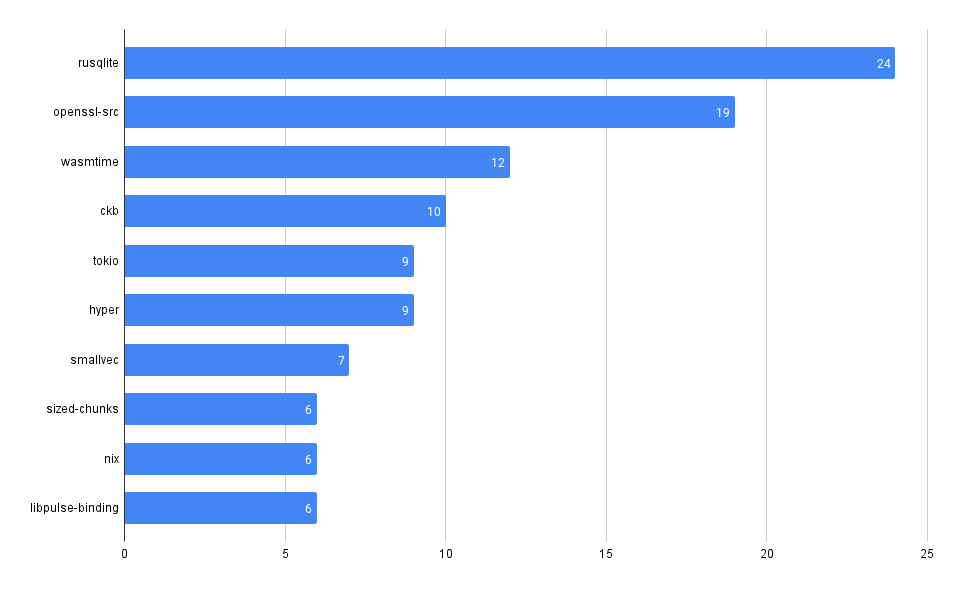
SELECT COUNT(*) as count, name, version, type
FROM syft_repo_artifacts
GROUP BY name, version, type
ORDER BY 1 DESC

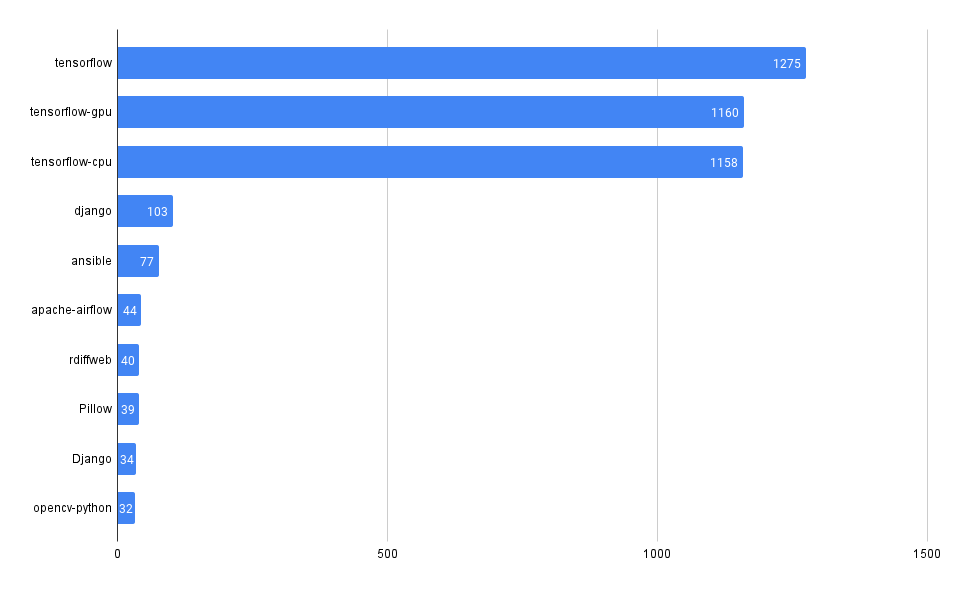
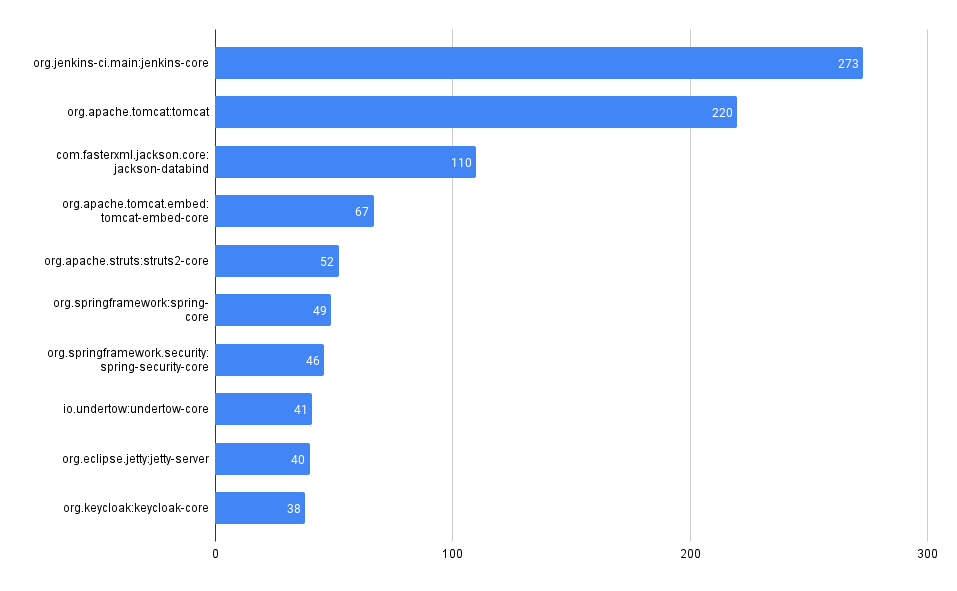
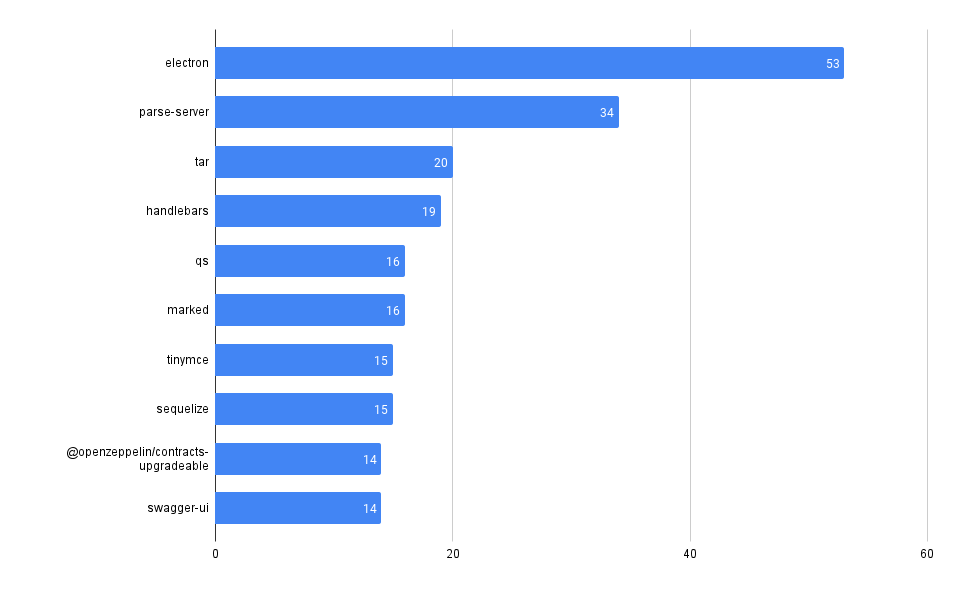
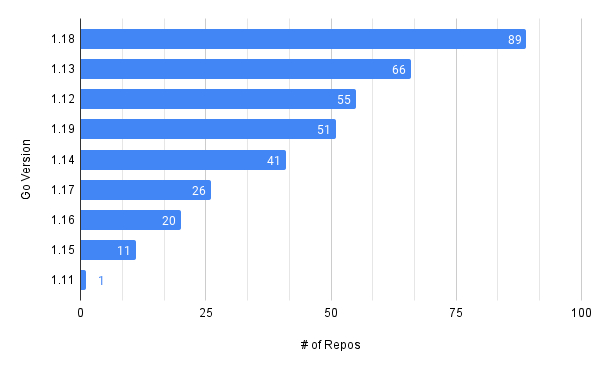
This gives us the most common SBOM artifacts in use across all repositories. This is a great starting point, as it gives us a sense of what languages and tools are in use throughout a companyโ€™s code. This is an โ€œout of the boxโ€ feature that MergeStat provides.

It also gives us a list of any โ€œkeyโ€ dependencies - the 3rd party libraries that are most commonly relied on throughout an organisation.

Most common SBOM artifacts across all repos

Show me the oldest files that contain security vulnerabilitiesโ€‹

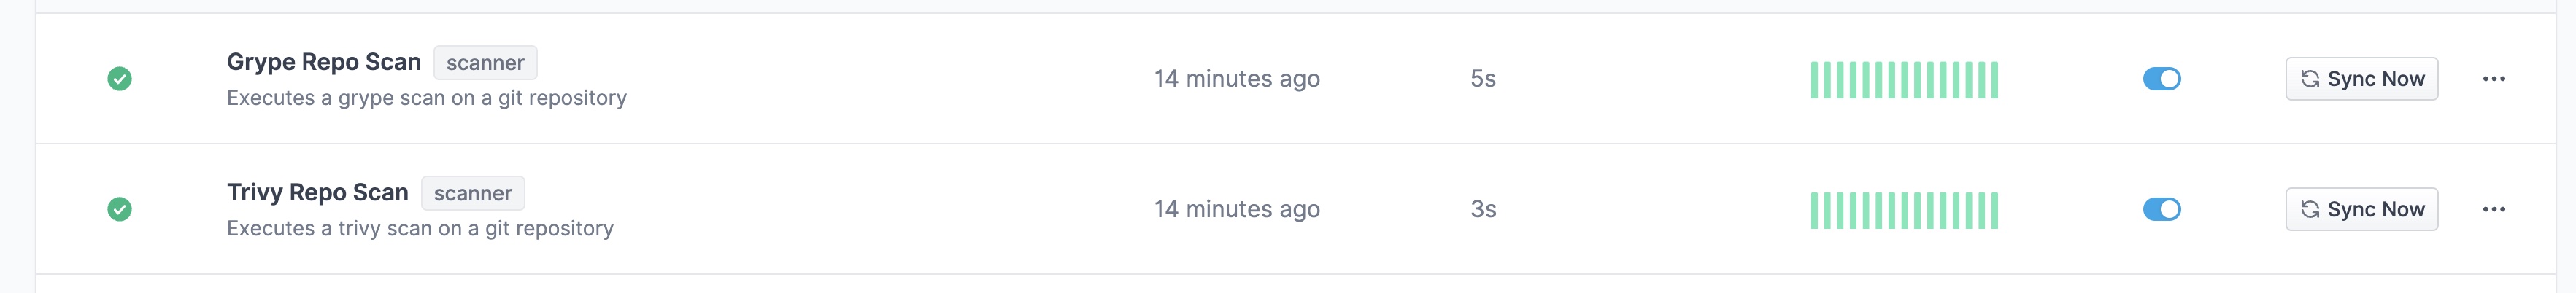
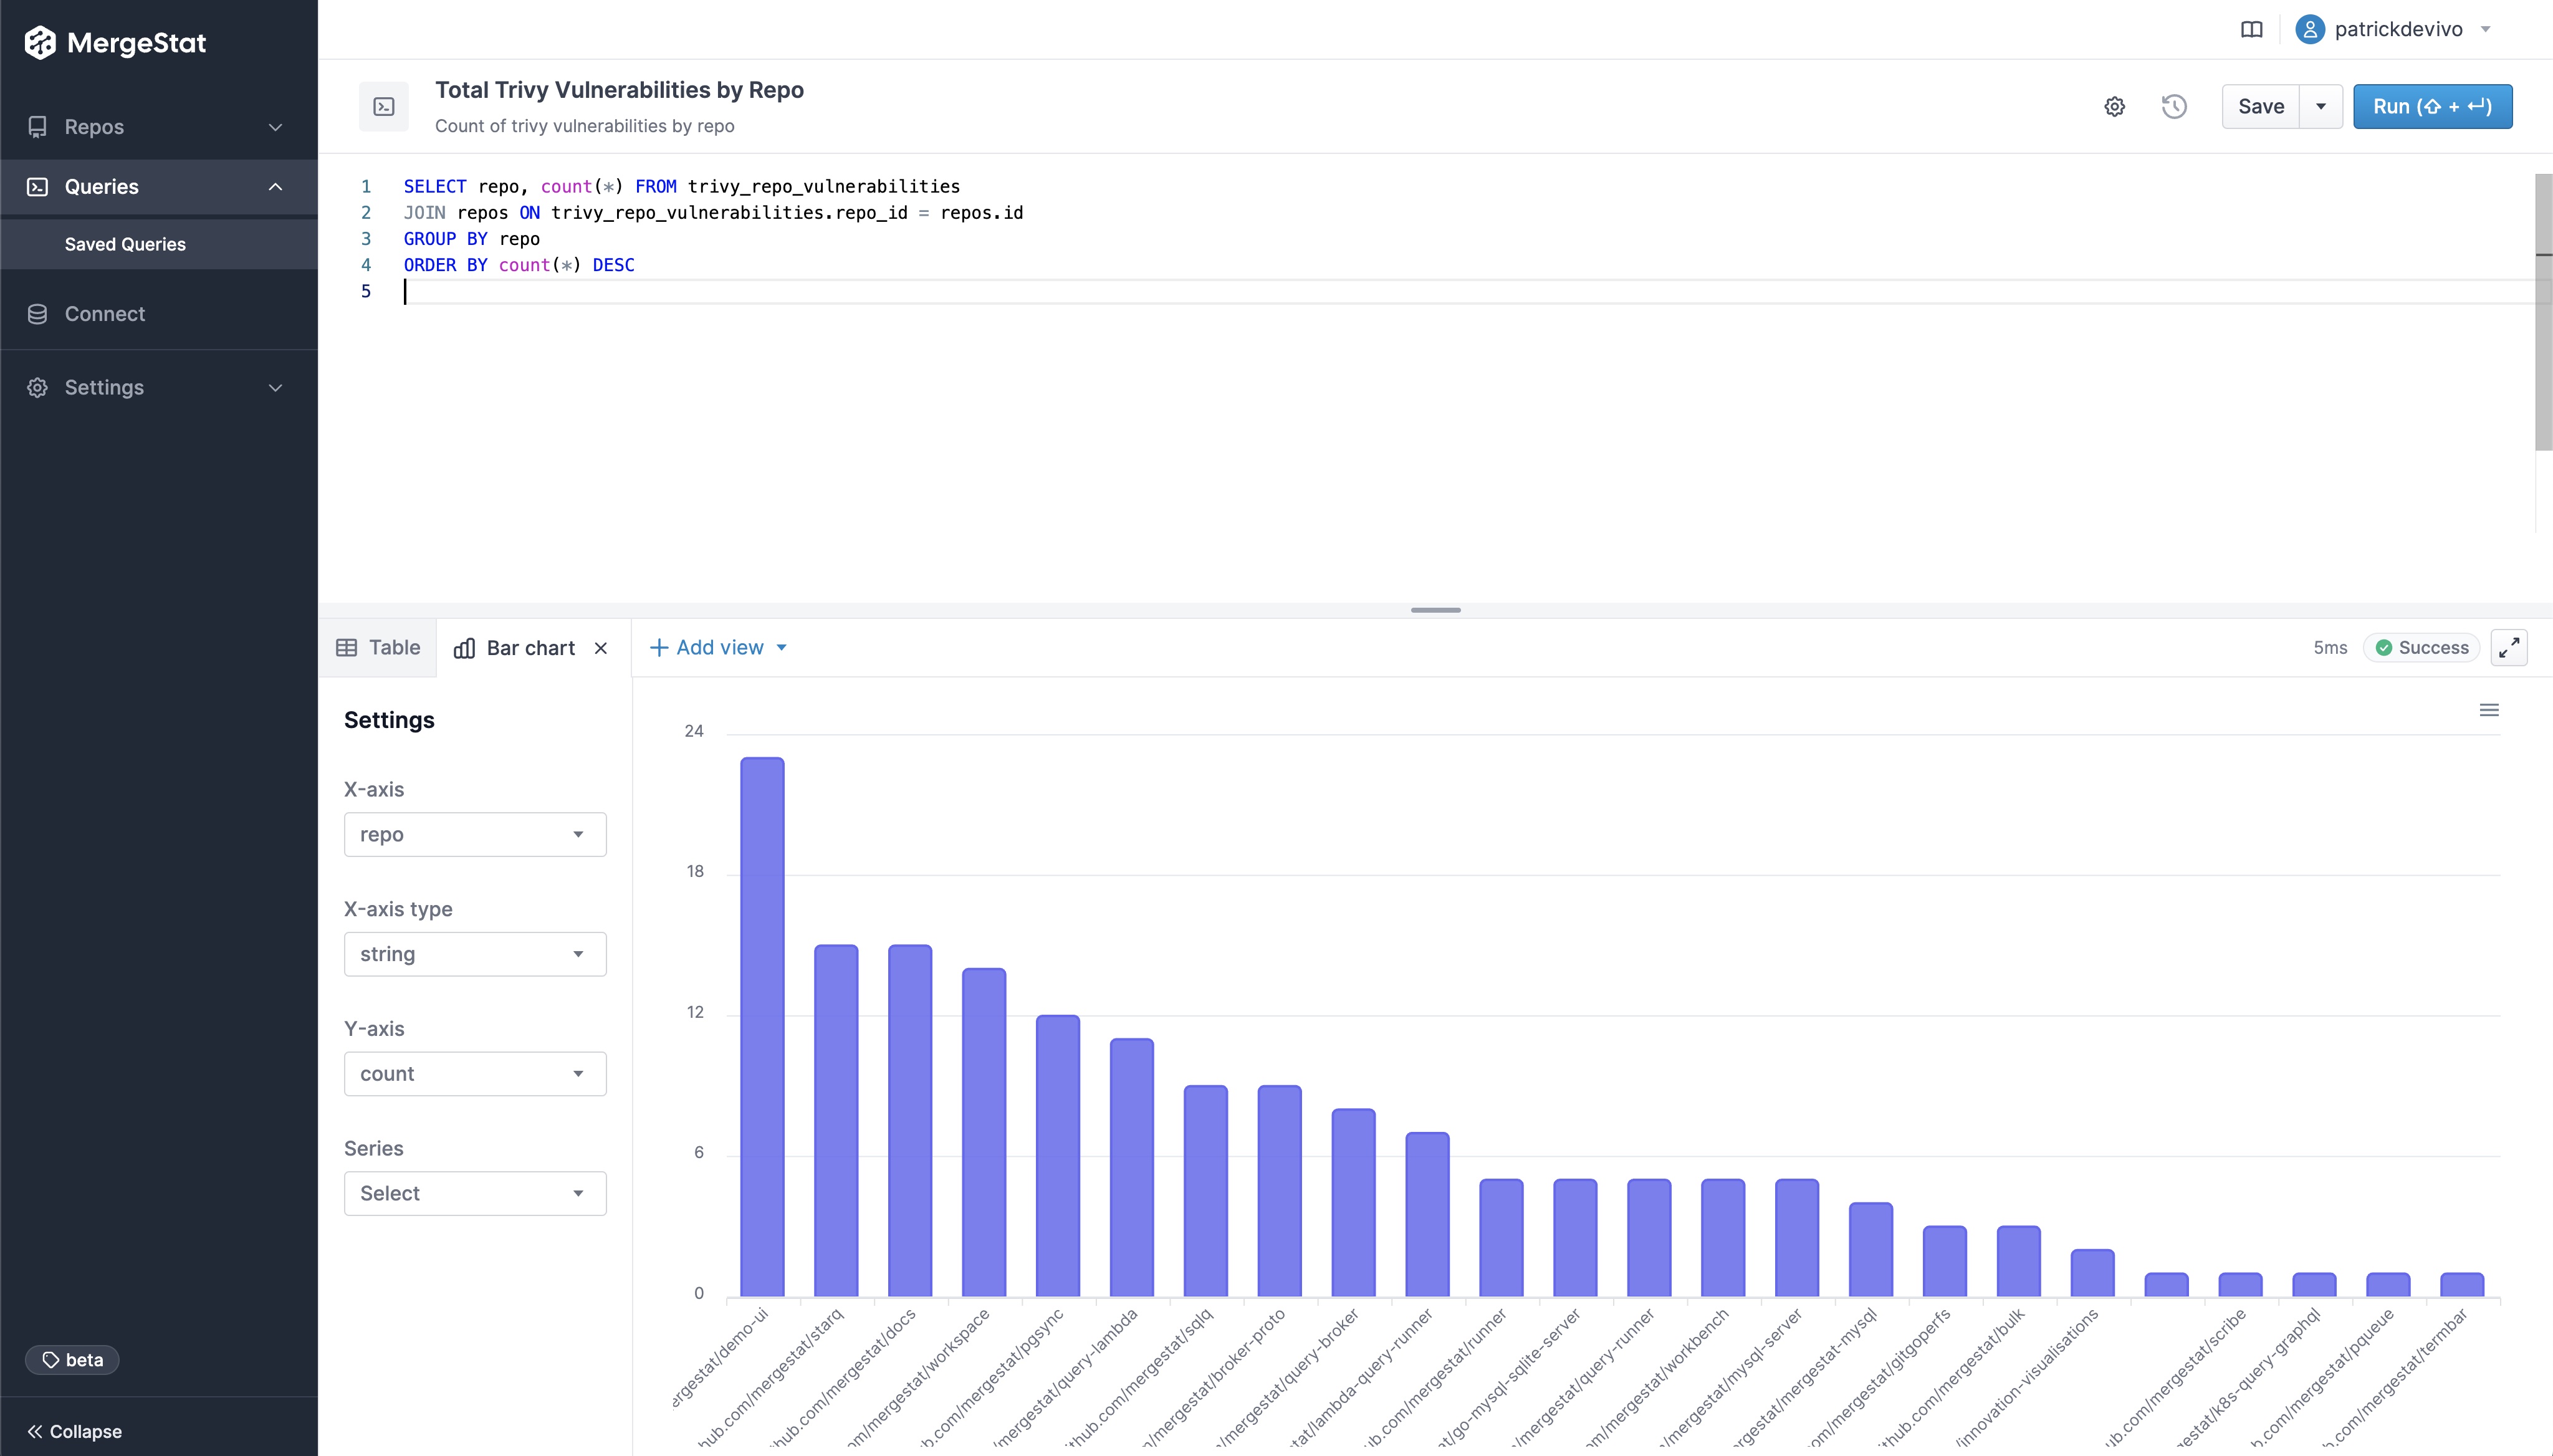
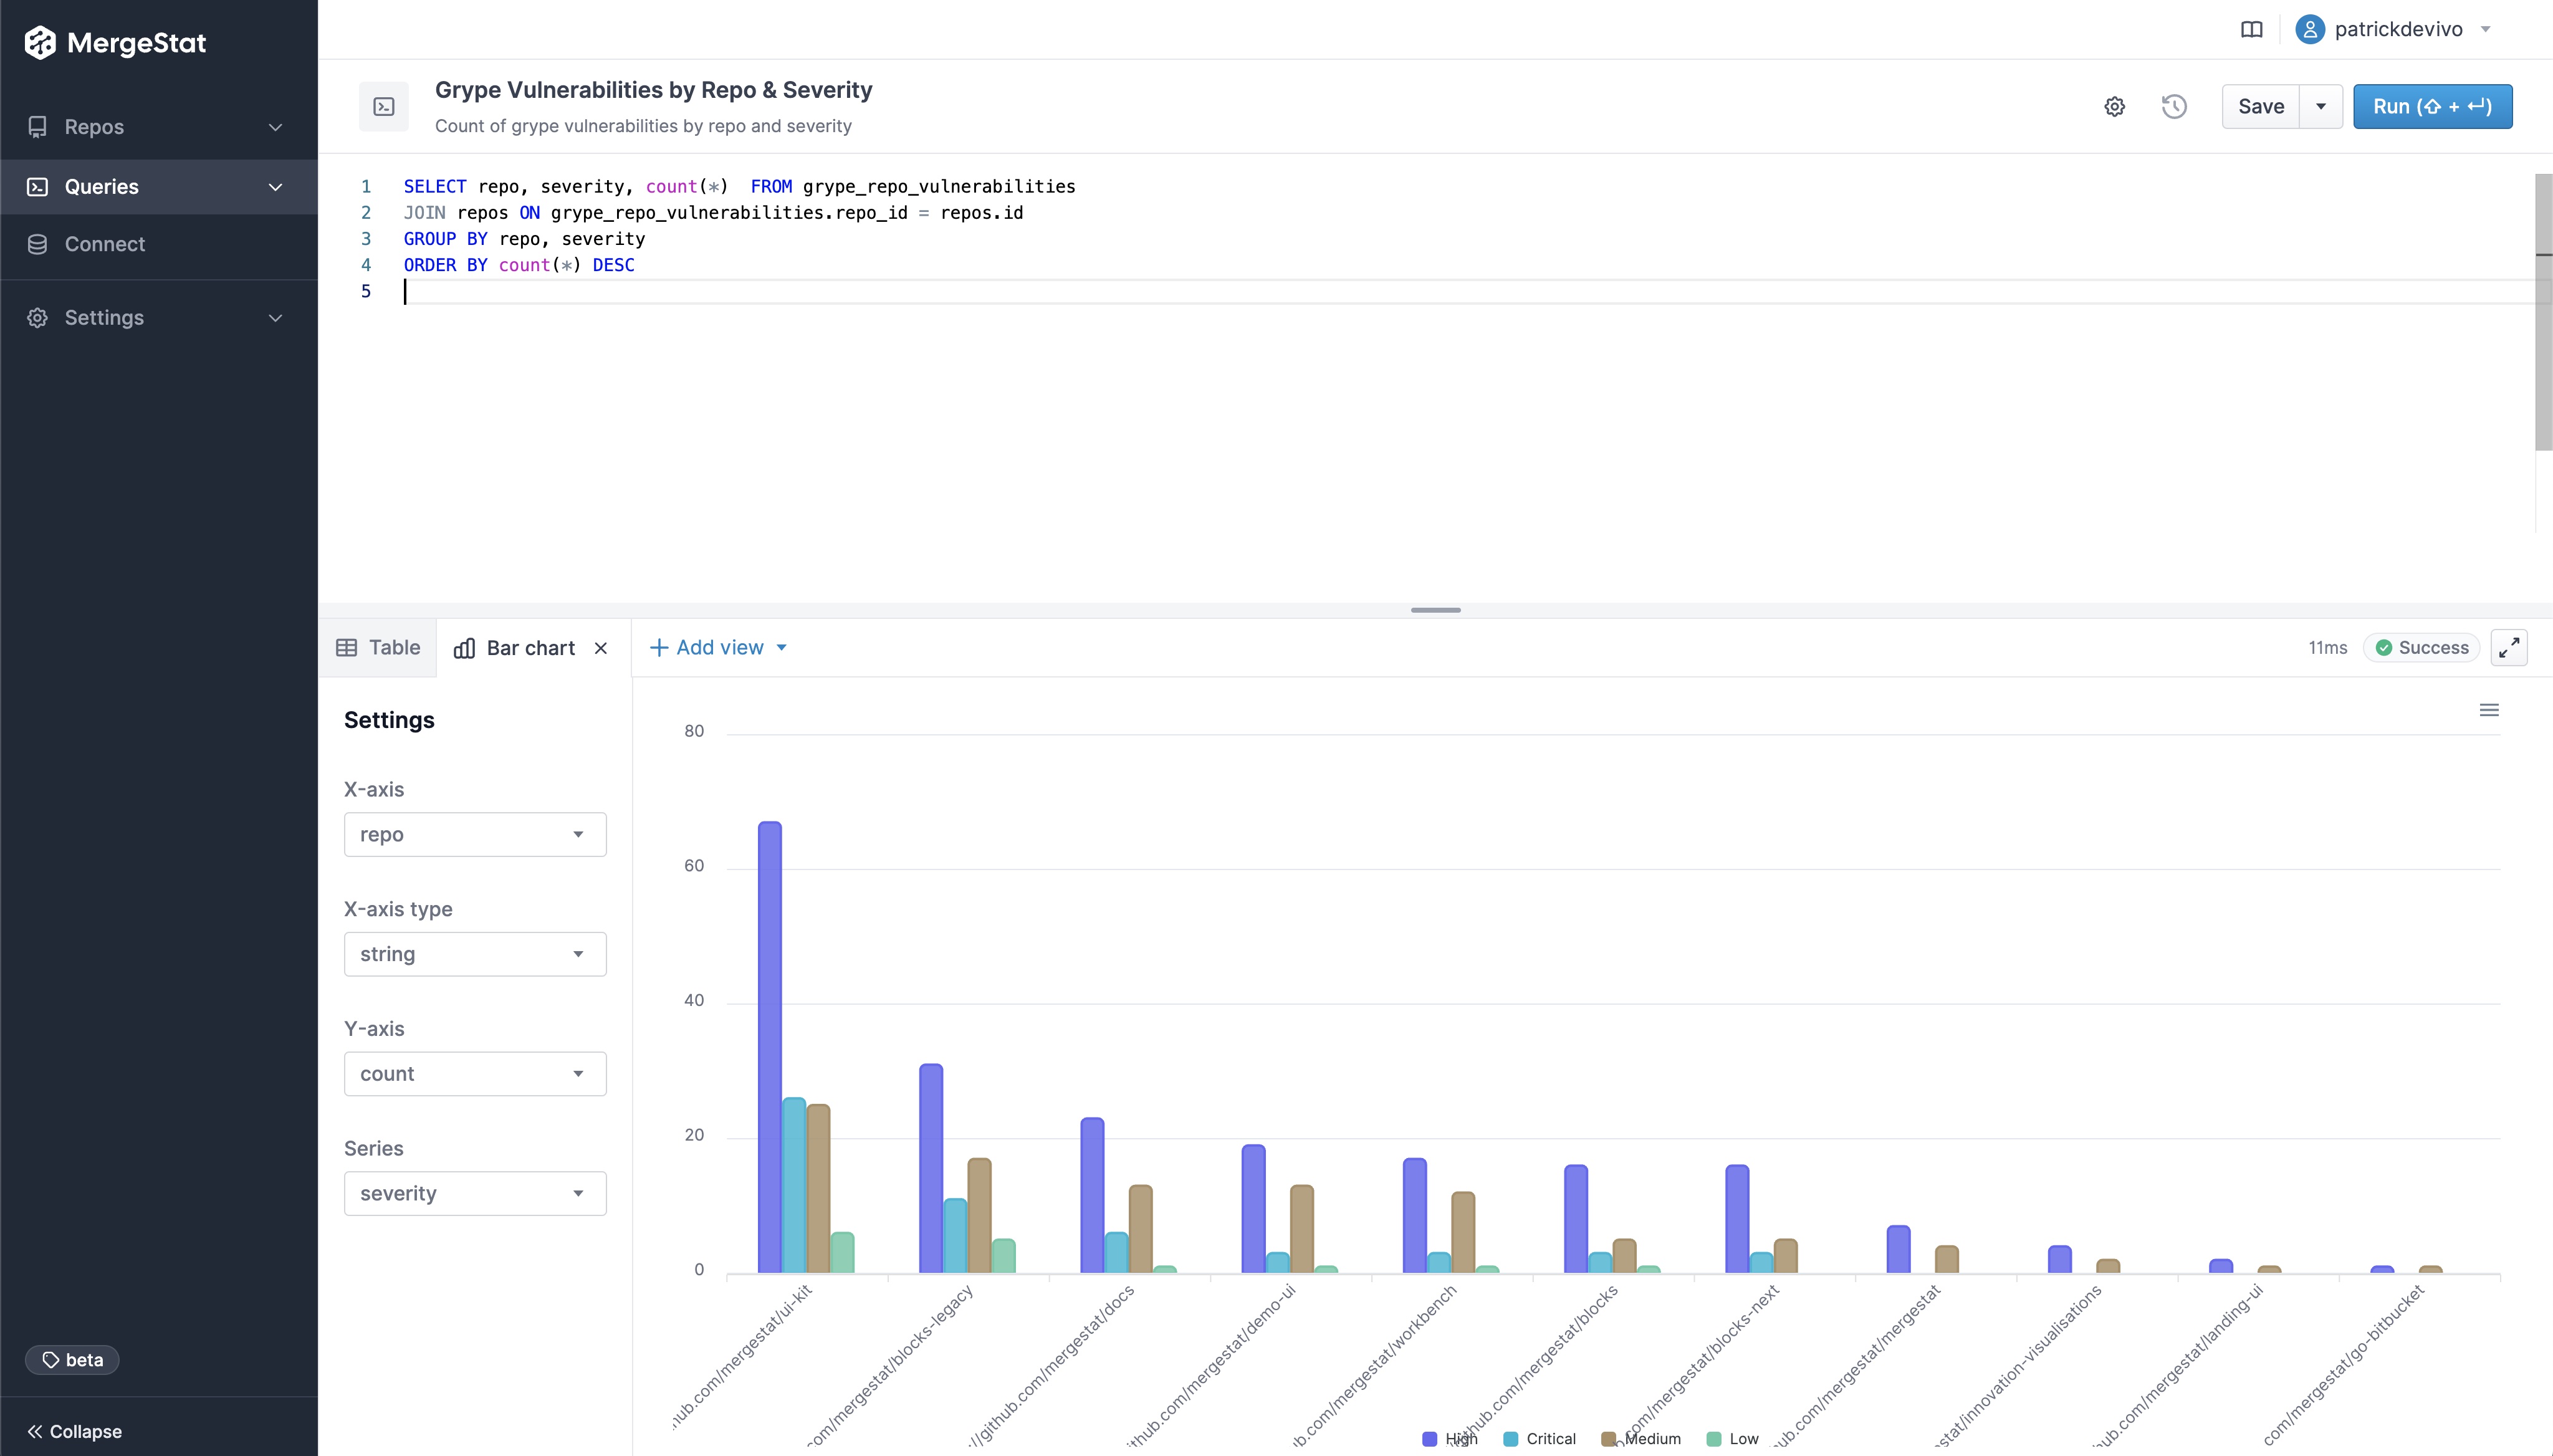
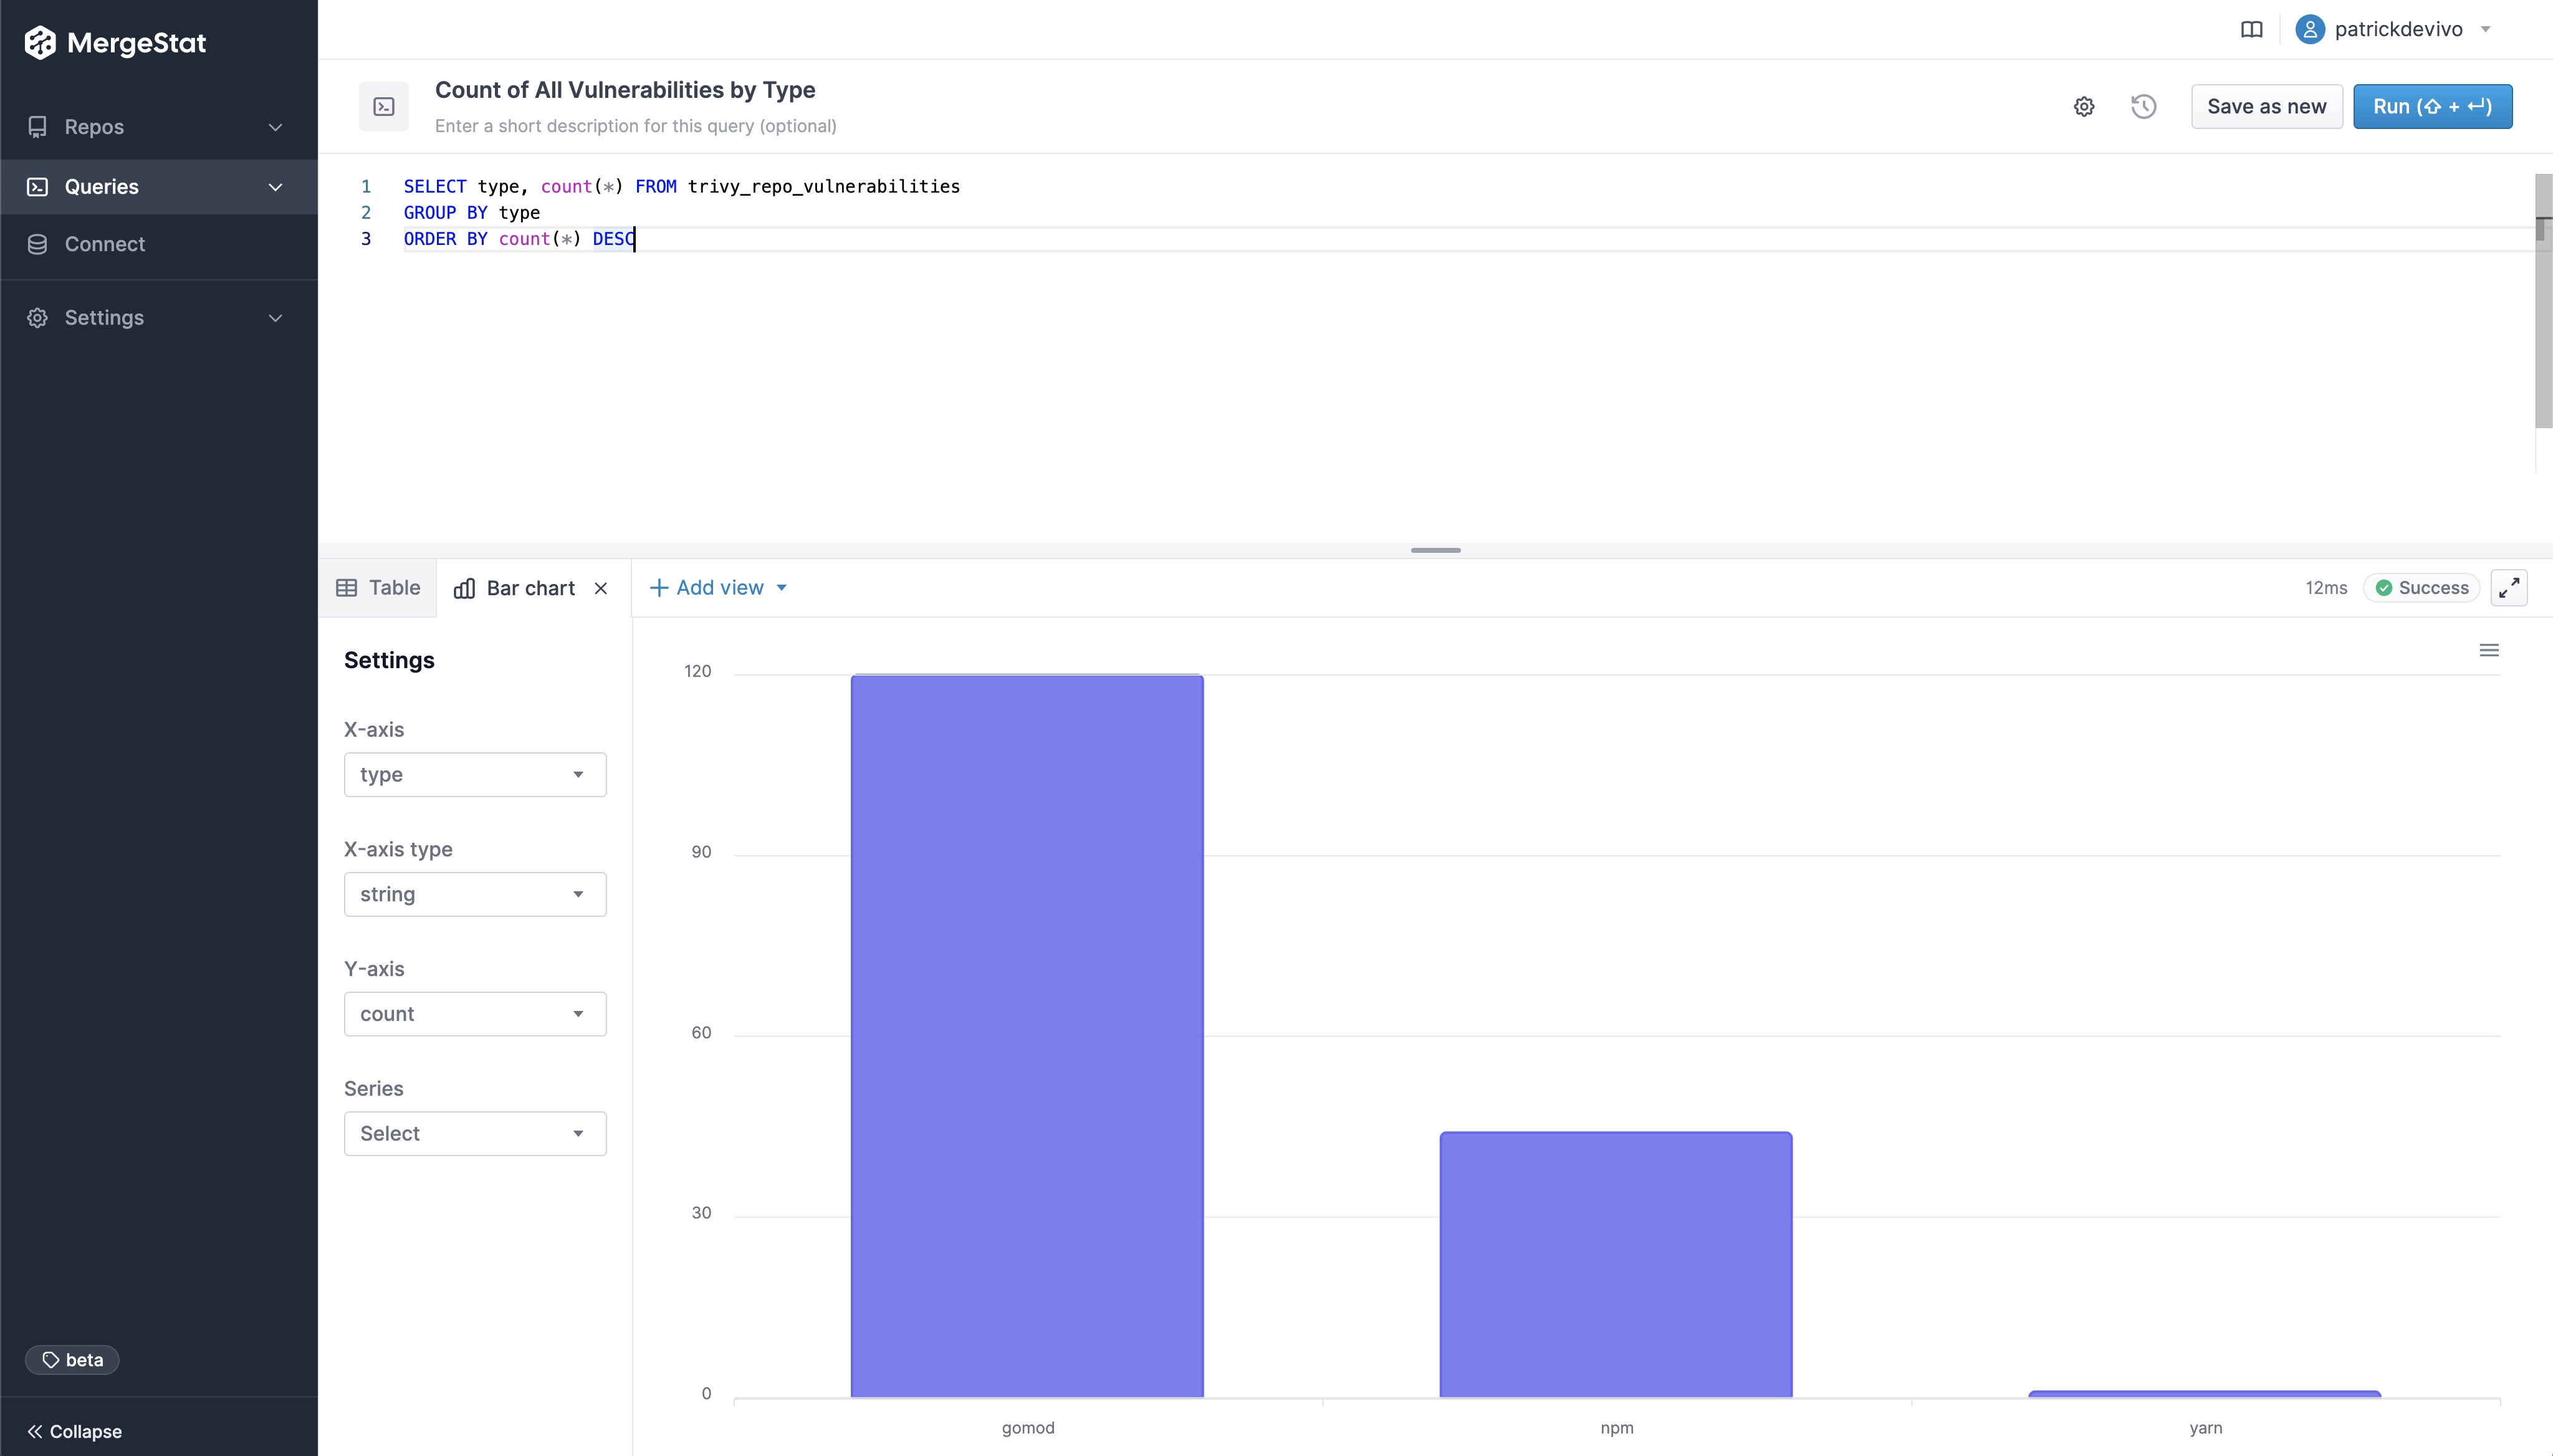
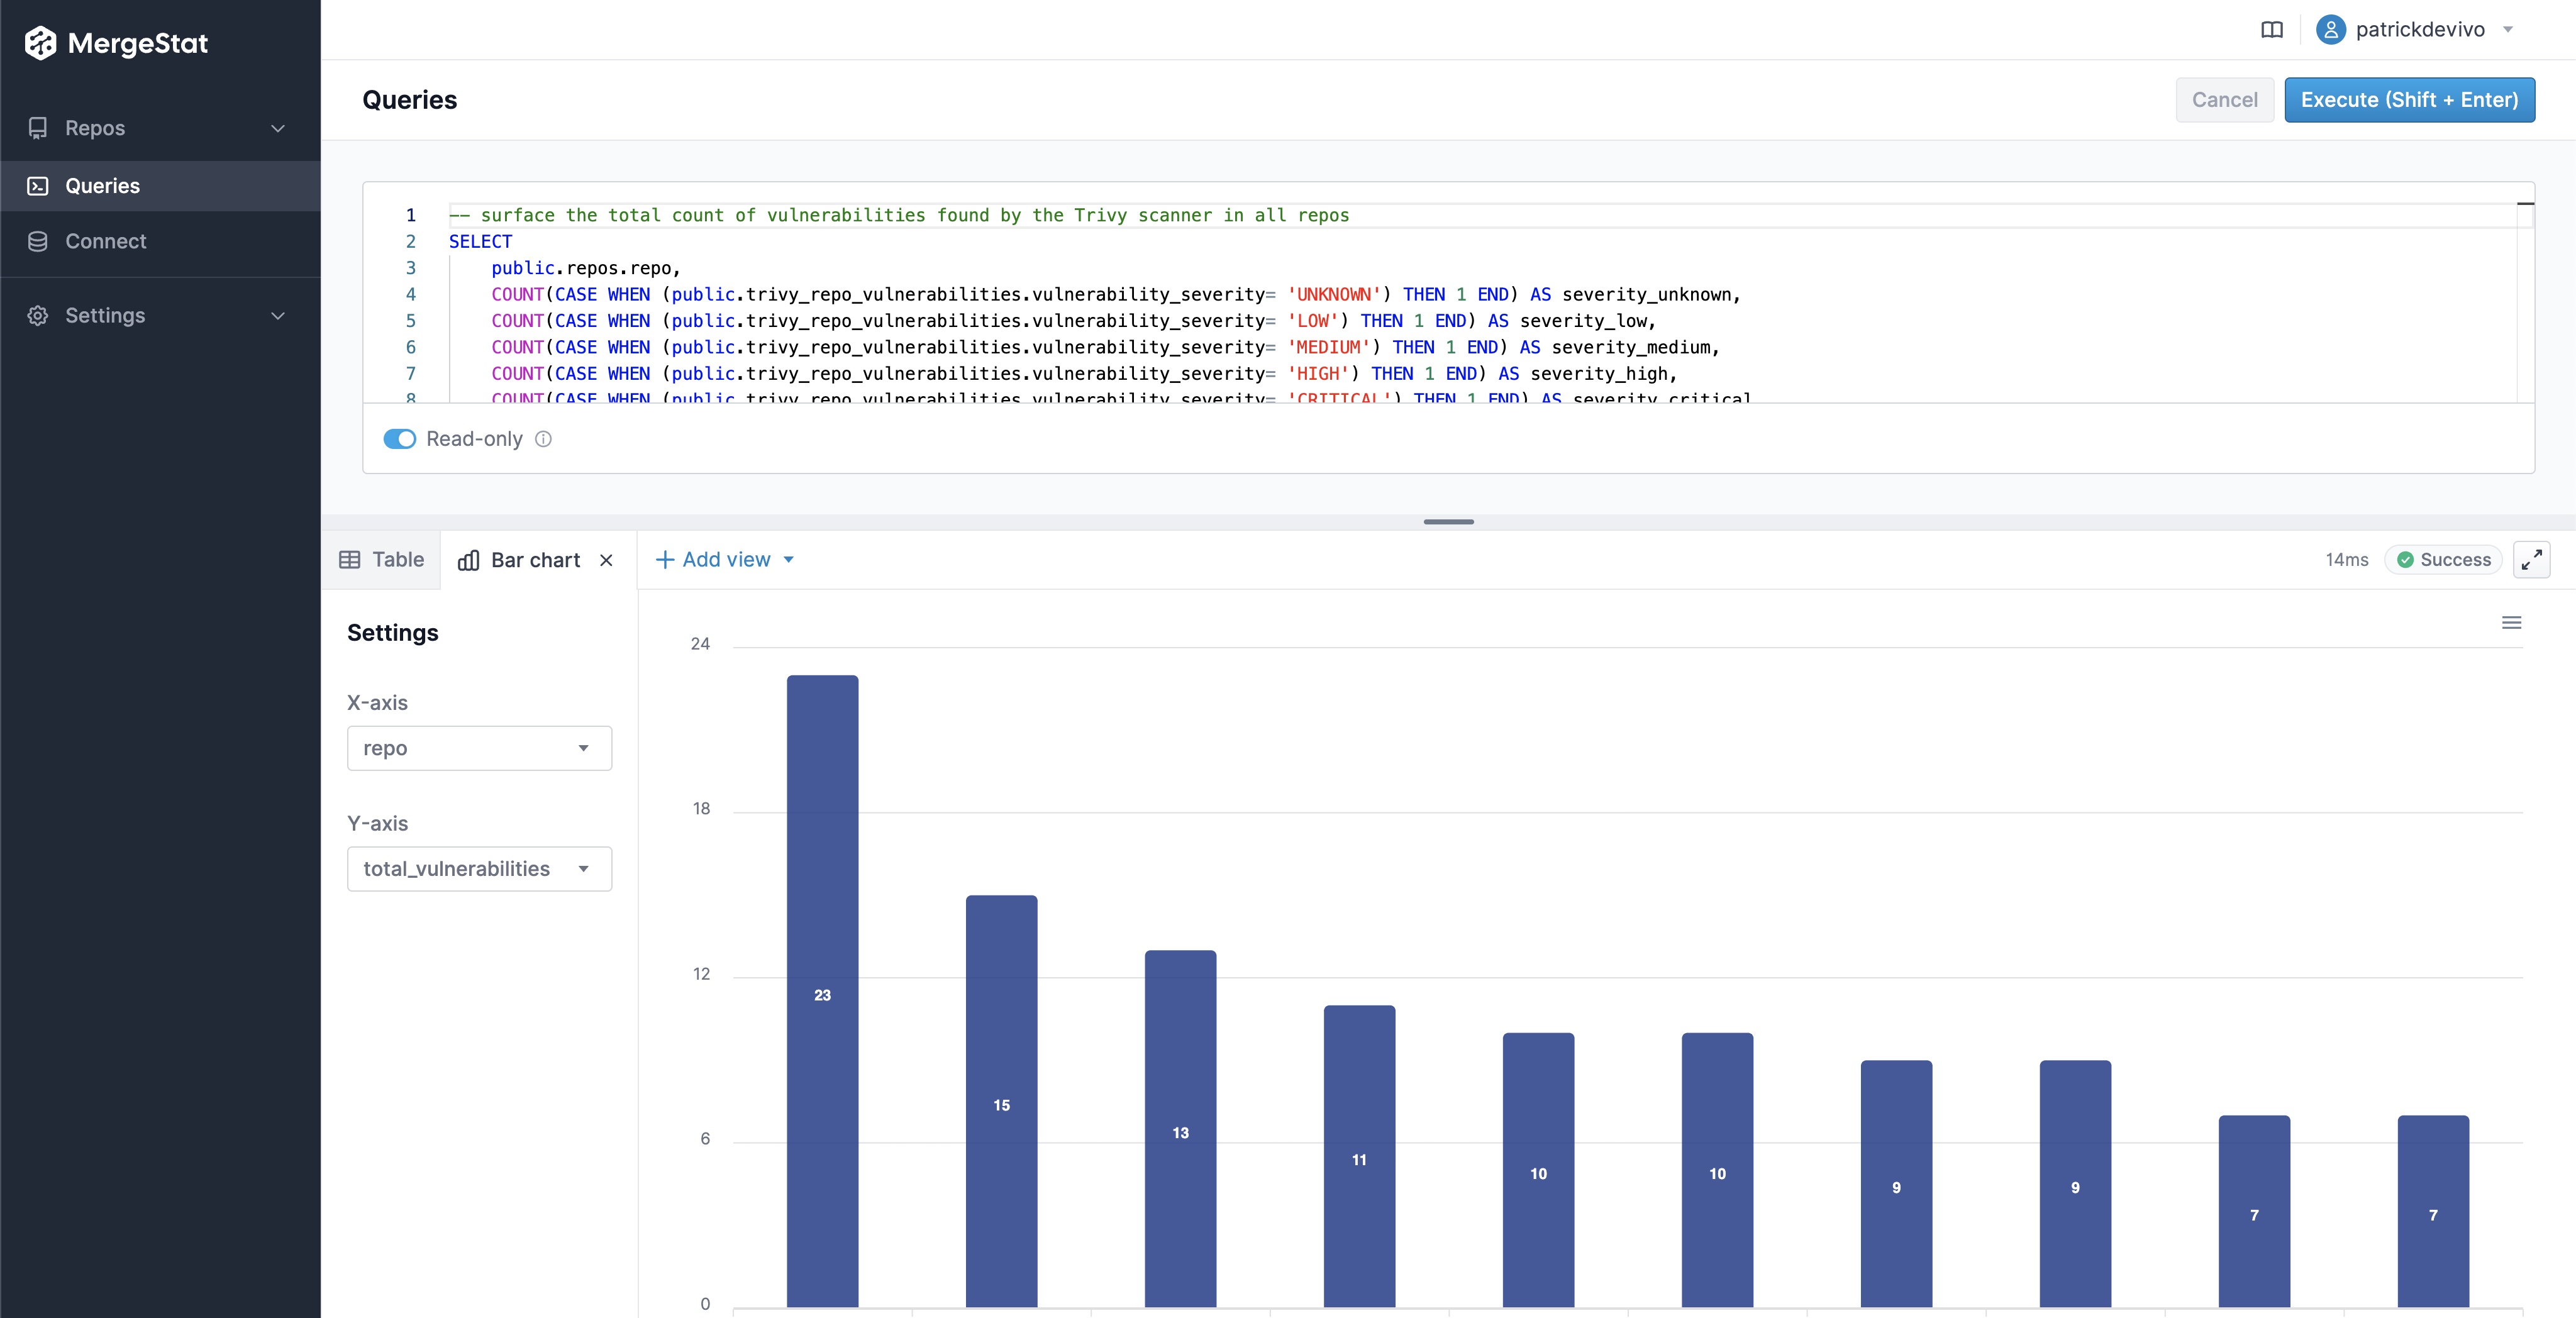
Similar to how MergeStat can generate an SBOM across many repos, it can run a vulnerability scan using a tool such as Trivy or Grype. Doing so allows us to surface detected vulnerabilities across the repos in an organisation. Combining this with Git activity allows us to also filter vulnerabilities based on when the related file was last modified. This allows us to order by the vulnerabilities in the least recently modified files first (as these may be a top priority to address, as theyโ€™ve been around for a while).

-- SELECT the top 10 oldest files that contain CRITICAL vulnerabilities
SELECT MAX(committer_when) last_commit_to_file, repo, target, vulnerability_id, vulnerability_pkg_name, vulnerability_installed_version, vulnerability_severity
FROM trivy_repo_vulnerabilities
INNER JOIN git_commit_stats ON trivy_repo_vulnerabilities.repo_id = git_commit_stats.repo_id AND trivy_repo_vulnerabilities.target = git_commit_stats.file_path
INNER JOIN git_commits ON git_commit_stats.repo_id = git_commits.repo_id AND git_commit_stats.commit_hash = git_commits.hash
INNER JOIN repos ON trivy_repo_vulnerabilities.repo_id = repos.id
WHERE vulnerability_severity = 'CRITICAL'
GROUP BY repo, target, vulnerability_id, vulnerability_pkg_name, vulnerability_installed_version, vulnerability_severity
ORDER BY 1 ASC
LIMIT 10

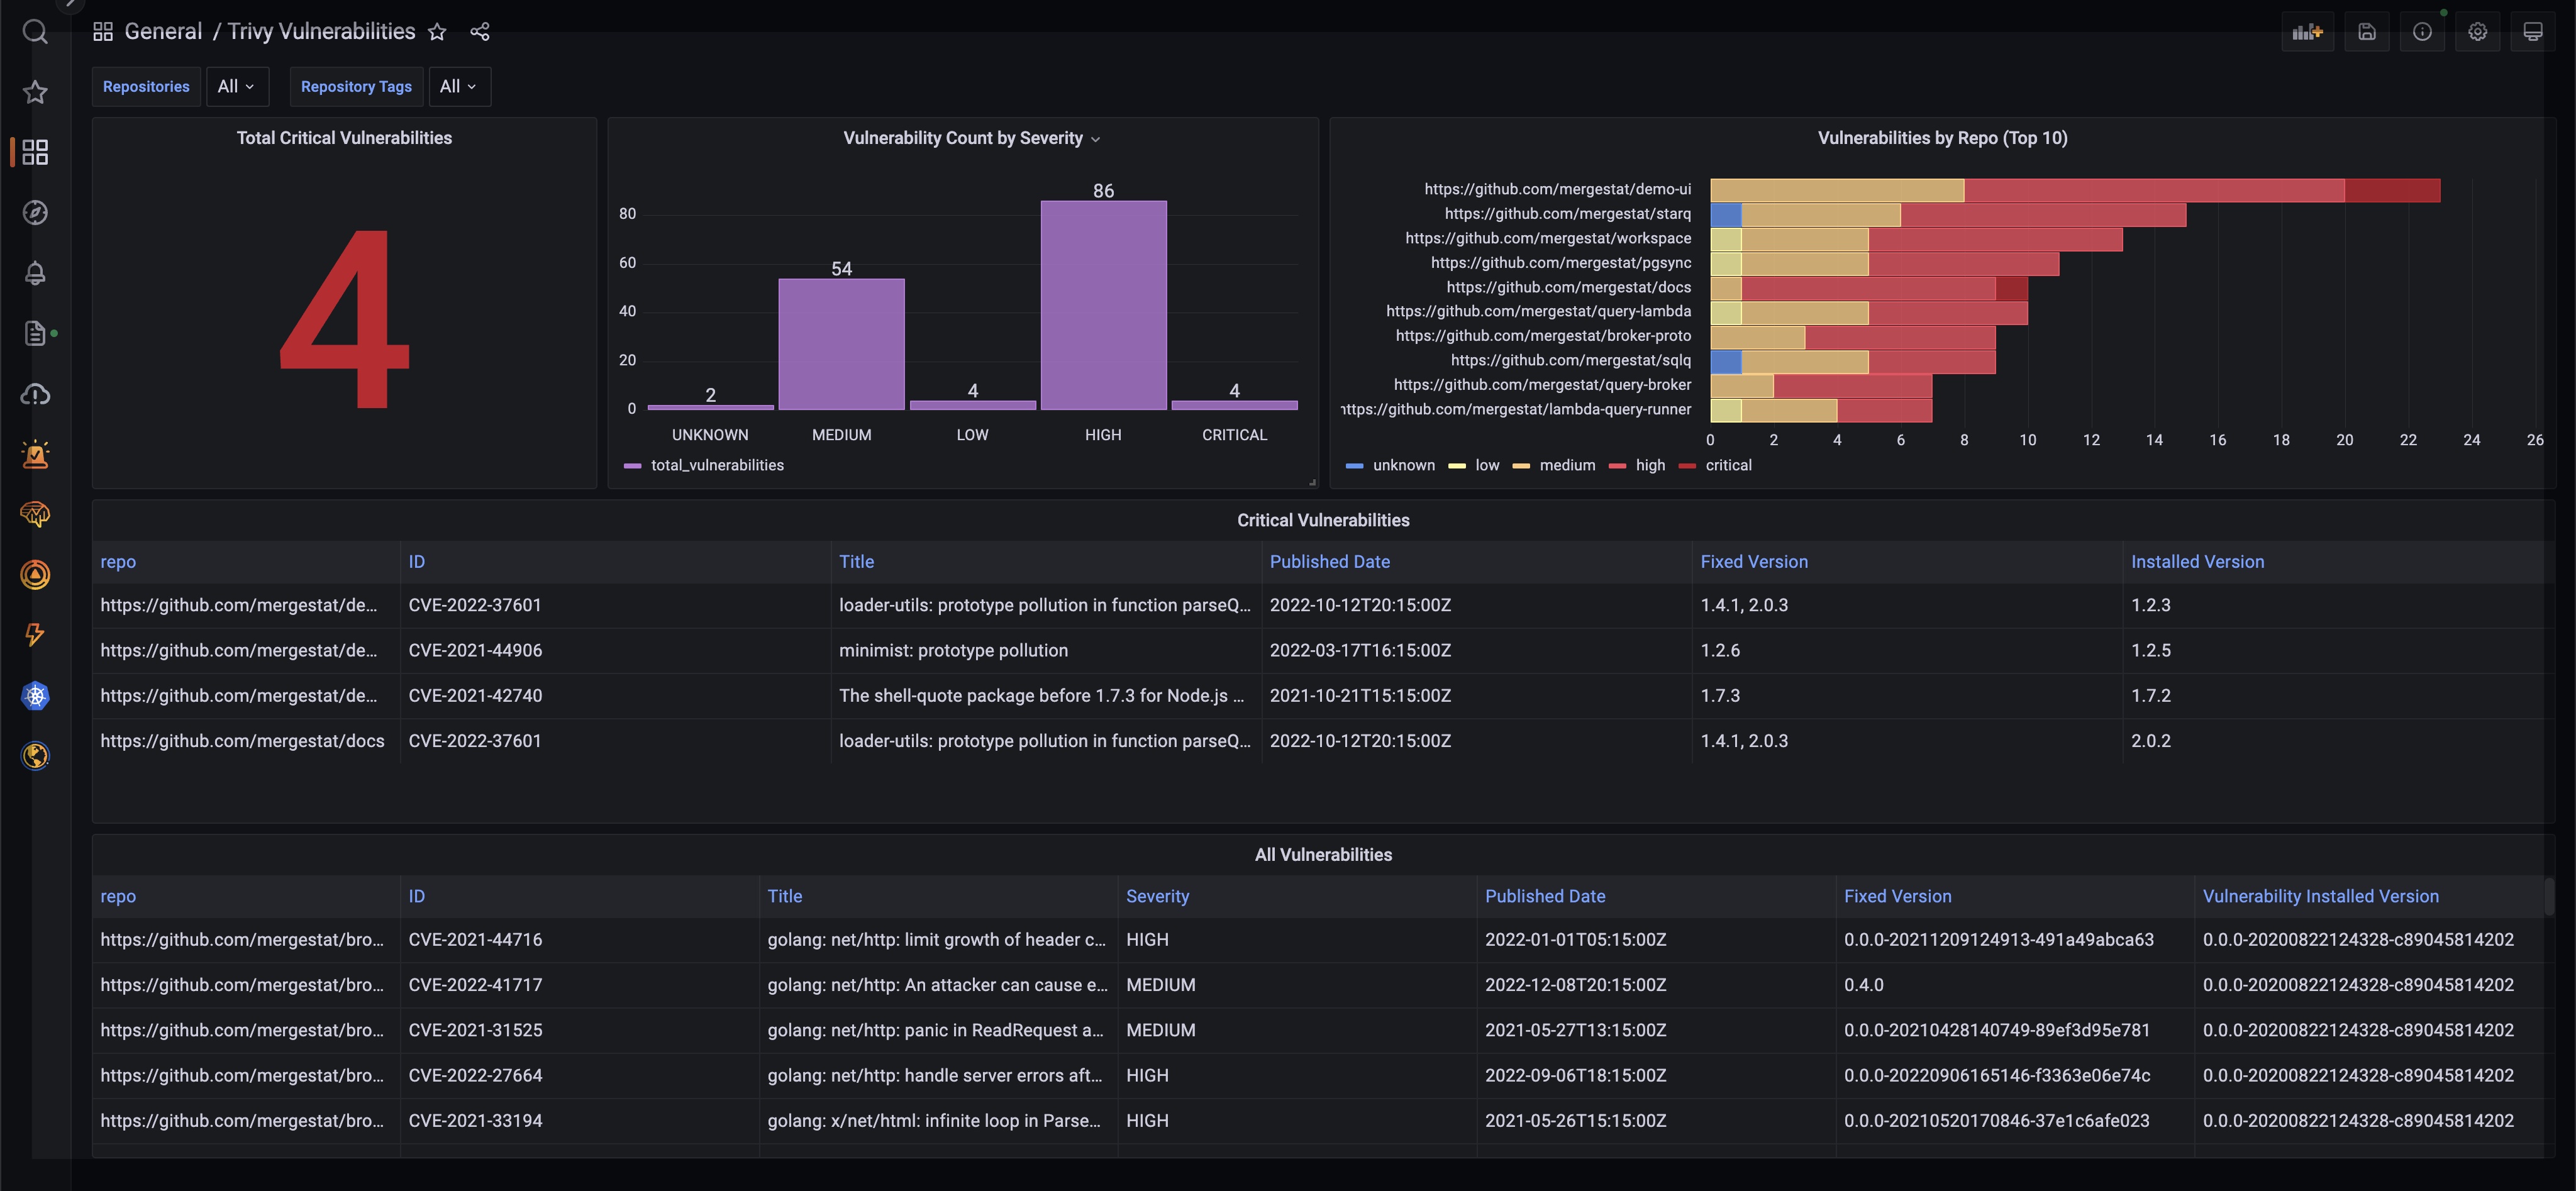
This query uses the Trivy integration to surface the top 10 oldest files (by when they were last modified) that contain a CRITICAL vulnerability. This serves as a starting point to identify high-priority vulnerabilities - most likely the most urgent and longest standing ones. Obviously, this query can be modified to suit your needs but it does illustrate the capability.

The key point is that once you can easily query or find the file types you want, running frequent analysis is easier and more repeatable.

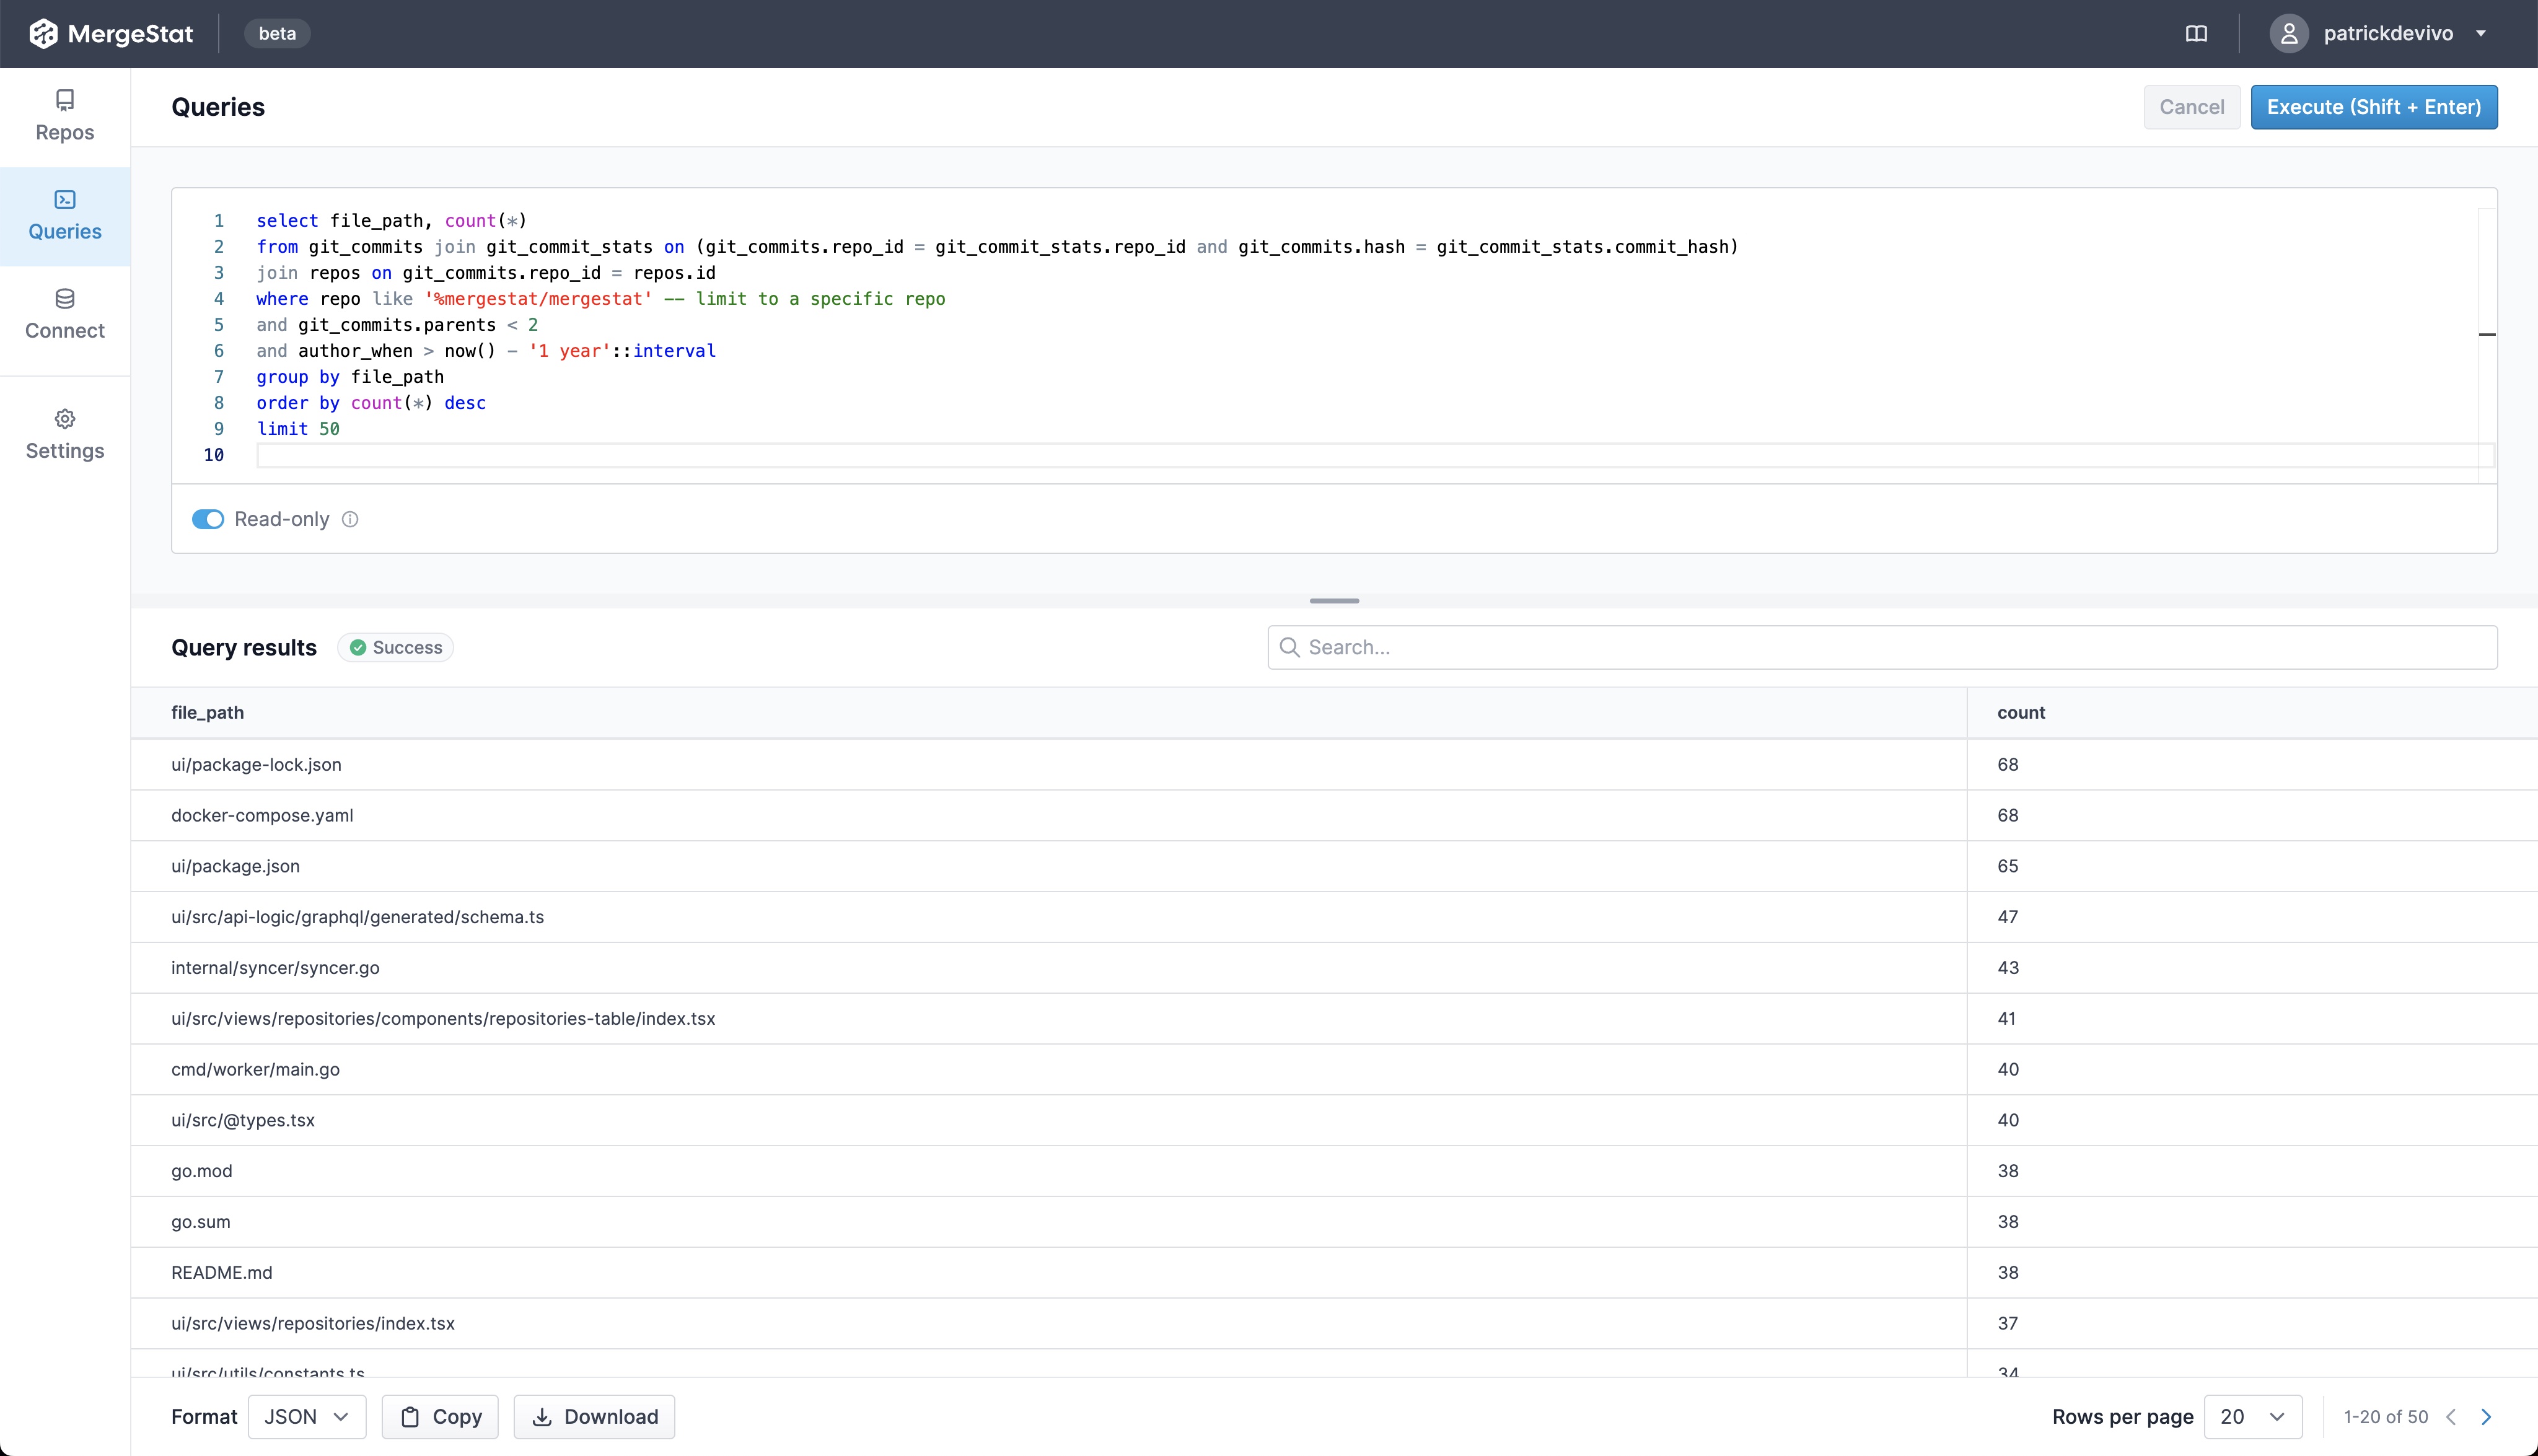
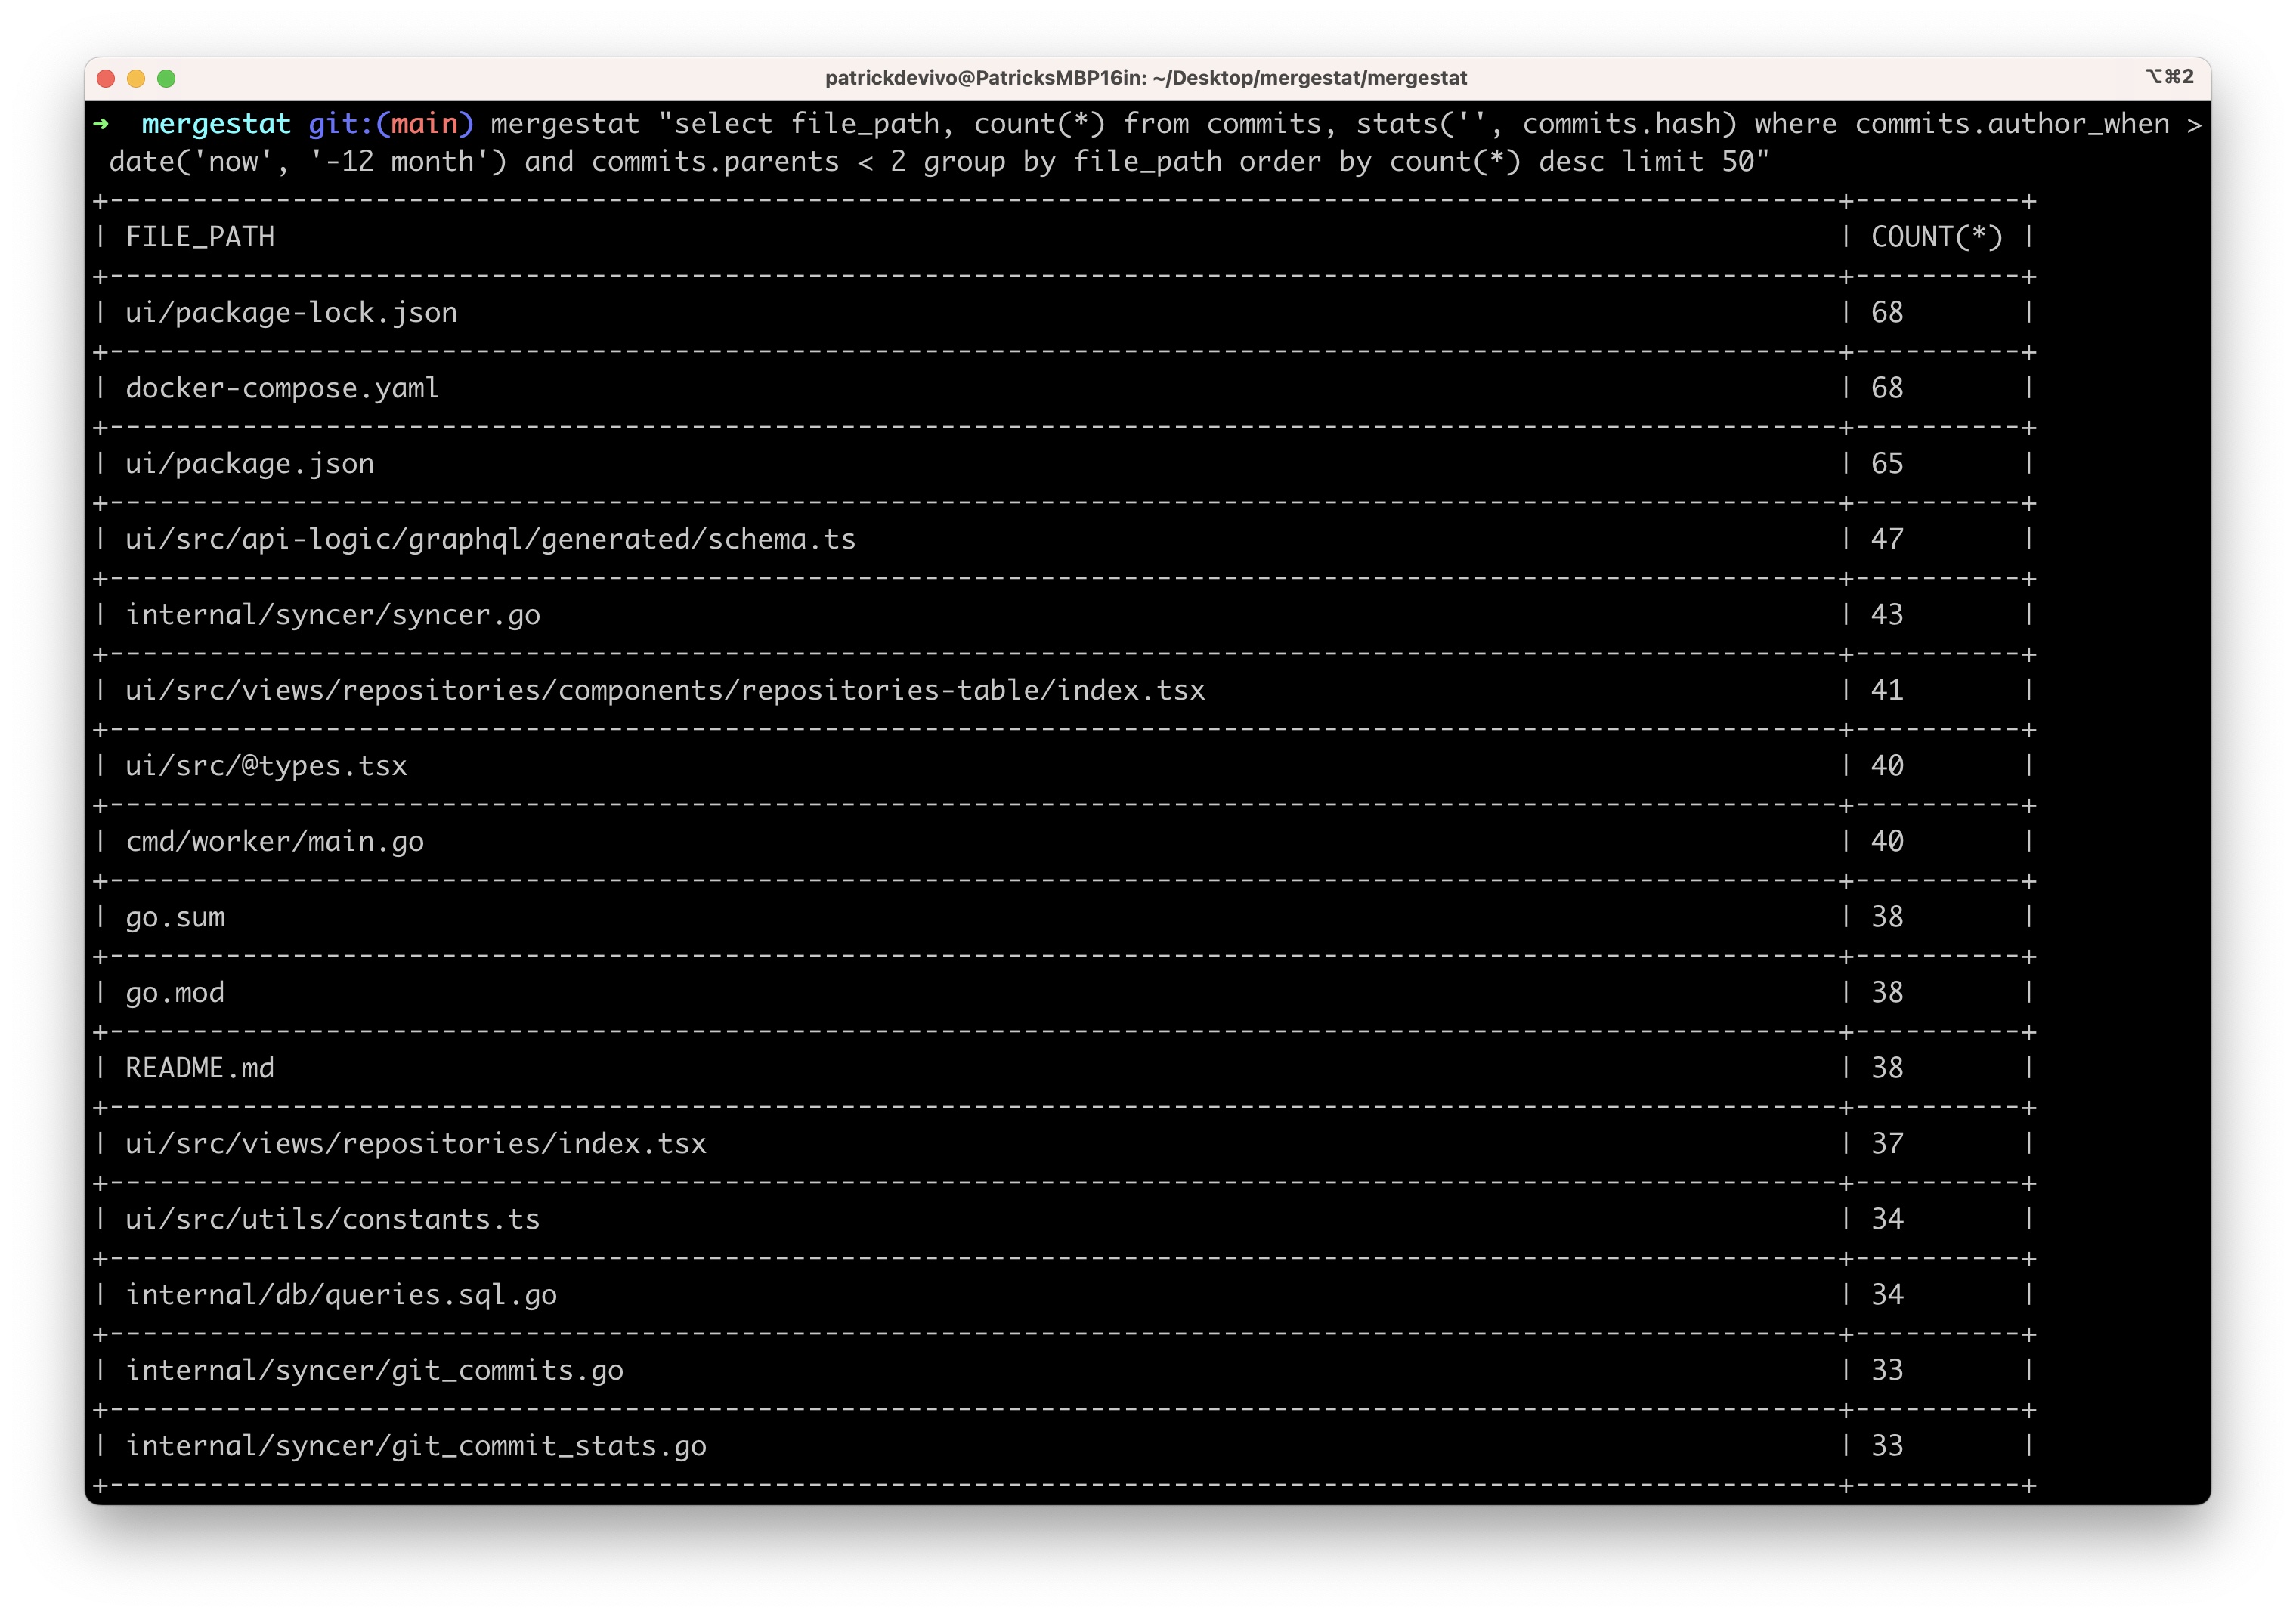
Show me who typically maintains 3rd party dependencies across codebasesโ€‹

Itโ€™s one thing to know where vulnerabilities are, itโ€™s another thing entirely to find the right people and process to mitigate these vulnerabilities with patches or upgrades. The last person to modify a file is probably a good person to help investigate and fix an issue. An additional query here thatโ€™s very valuable to me, is one that shows who are the most frequent committers to dependency manifest files in recent history?

-- show authors with most (non-merge) commits that change package.json files in the last year
SELECT count(*), author_name, author_email, file_path, repo FROM git_commits
JOIN git_commit_stats ON git_commits.hash = git_commit_stats.commit_hash
JOIN repos ON git_commits.repo_id = repos.id
WHERE file_path LIKE '%package.json' AND author_when > now() - '1 year'::interval AND parents < 2
GROUP BY author_name, author_email, file_path, repo
ORDER BY count(*) DESC

The query above can be modified easily to:

  • Look at go.mod, requirements.txt, Gemfile, etc instead for different package ecosystems
  • Look at a different time frame - maybe 1 year is too long (lots of engineering churn) and 1 month is a better filter
  • Filter for specific code bases - maybe youโ€™re only concerned with one or two code bases, as thatโ€™s where your focus is.

What Next?โ€‹

These queries are a way to produce a high-level survey of the open-source risk profile of code bases across an organisation. Getting data from either direct integration of tools (e.g. Trivy, Grype) or just looking for older package manager files provides a good starting point for a security program.

These queries can be expanded on to answer additional questions:

  • What teams or code bases do a better job of keeping dependencies up to date and vulnerabilities out of main?
  • Are there individuals or teams who typically update dependencies across many code bases in the organisation? If so, are these good people to target for additional questions about security maintenance?

Once you have your git data sources plumbed into MergeStat, you can query as needed alternating between engaging in discovery and analysing immediate issues.

In Part 2, weโ€™ll cover how to use MergeStat to starting identify overall exposure to a single vulnerability (such as a Log4Shell) that may be thrust upon your day and answer questions in a similar way. Stay tuned!

Join our Slack

If you found this interesting, hop in our community Slack! We're always happy to chat about MergeStat there ๐ŸŽ‰.

Patrick DeVivo

We've been big fans of Renovate, an open-source tool and GitHub app that automates dependency management by opening PRs into your repos. In particular, we've loved:

  • The breadth of supported dependency types, including Dockerfiles, Helm Charts and GitHub Actions
  • PRs are rate limited, so that we're not overwhelmed with code changes to review
  • Respect for conventional commits

Recently, we wanted to know which of our repos had Renovate installed, which is a use case several folks have now shared with us! This post showcases some of the queries we put together around our use of Renovate.

We spun up an instance of MergeStat and begin writing some queries ๐ŸŽ‰.

Which Codebases Have Renovate Installed?โ€‹

Get the list of repos that have Renovate installed (by looking for a renovate.json config file in the root of the repo).

-- which repos have a renovate.json file in the root
SELECT repo, path FROM git_files
JOIN repos ON git_files.repo_id = repos.id
WHERE path = 'renovate.json'

Retrieve when the renovate.json file was added to a codebase, by looking at the commit history.

-- how long ago (in days) were renovate.json files added to our repos
SELECT
repo,
max(author_when) AS last_modified,
ROUND(EXTRACT(EPOCH FROM now() - max(author_when))/86400, 2) AS last_modified_days_ago,
min(author_when) AS first_added,
ROUND(EXTRACT(EPOCH FROM now() - min(author_when))/86400, 2) AS first_added_days_ago
FROM git_commit_stats
JOIN git_commits ON git_commit_stats.commit_hash = git_commits.hash
JOIN repos ON git_commit_stats.repo_id = repos.id
WHERE file_path = 'renovate.json'
GROUP BY repo
ORDER BY first_added ASC

Screenshot showing a query of when renovate.json files were added to repos

How Many Renovate PRs Have Been Opened?โ€‹

-- total count of renovate PRs across repos
SELECT count(*) FROM github_pull_requests
WHERE author_login = 'renovate'
-- count of renovate PRs across repos by state
SELECT state, count(*)
FROM github_pull_requests
WHERE author_login = 'renovate'
GROUP BY state
ORDER BY count(*) DESC

Screenshot of renovate PRs by state

What Files Does Renovate Typically Modify?โ€‹

When a Renovate PR merges, what files is it typically making changes to?

-- count of modifications made by Renovate to specific files
SELECT file_path, count(*) FROM git_commits
JOIN git_commit_stats ON git_commits.hash = git_commit_stats.commit_hash
JOIN repos ON git_commits.repo_id = repos.id
WHERE author_name = 'renovate[bot]'
GROUP BY file_path
ORDER BY count(*) DESC

Here's example output from our codebases:

file_pathcount
package-lock.json259
package.json231
go.mod37
go.sum36
.nvmrc12
.github/workflows/linter.yaml6
.github/workflows/lint-test.yaml6
renovate.json6
.github/workflows/release.yml5
.github/workflows/chromatic.yml4

Show the Cumulative Sum of Merged Renovate PRsโ€‹

How much has Renovate actually been up to - and how much value are we getting from it over time?

-- calculate the cumulative sum of merged renovate PRs over time
WITH data As (
SELECT
date_trunc('day', created_at) AS day,
count(1)
FROM github_pull_requests
WHERE author_login = 'renovate' AND state = 'MERGED'
GROUP BY 1
)
SELECT
day,
sum(count) OVER (ORDER BY day ASC rows BETWEEN UNBOUNDED PRECEDING AND CURRENT ROW)
FROM data

Cumulative sum of merged Renovate PRs over time

How Quickly Are Renovate PRs Merged?โ€‹

What's the distribution of time-to-merge (measured as the number of days between PR creation and merge) of Renovate PRs.

SELECT
FLOOR((EXTRACT(EPOCH FROM merged_at - created_at)/86400)/5)*5 as bin_floor,
count(*)
FROM github_pull_requests
WHERE author_login = 'renovate' AND state = 'MERGED'
GROUP BY 1
ORDER BY 1

Histogram of renovate time-to-merge

Conclusion

We were curious to play around with this data to learn about our use of Renovate and the value we've been getting from it. If you're a Renovate user, hopefully it's interesting to you as well!

Join our Slack

If you found this interesting, hop in our community Slack! We're always happy to chat about MergeStat there ๐ŸŽ‰.

Patrick DeVivo

MergeStatโ€™s mission is to make it possible to query anything thatโ€™s involved in building and shipping software with SQL. One aspect of building and shipping software is the management of open-source security vulnerabilities in the โ€œsupply chainโ€ of dependencies your code uses.

In this post, weโ€™ll explore how MergeStatโ€™s integration with code scanners Grype and Trivy allows us to put together an open-source solution for managing vulnerabilities across many Git repositories.

Setupโ€‹

To get started, you'll want an instance of MergeStat (check out how to get started locally). Once you've added your Git repos, turn on the Grype and Trivy scanner syncs:

Screenshot showing the Grype and Trivy scanner configs

Runs of these syncs should begin populating the following views:

  • grype_repo_vulnerabilities
  • trivy_repo_vulnerabilities

Where each row is a vulnerability detected in a repo by one of the tools.

Now, let's see how we can query these vulnerabilities to get a sense of where (what repos) we have the most vulnerabilities in, and what the severity make up looks like.

Total Vulnerability Count by Repoโ€‹

These queries look at the total counts of vulnerabilities surfaced in each of the codebases in MergeStat.

-- Count of trivy vulnerabilities by repo
SELECT repo, count(*) FROM trivy_repo_vulnerabilities
JOIN repos ON trivy_repo_vulnerabilities.repo_id = repos.id
GROUP BY repo
ORDER BY count(*) DESC
-- Count of grype vulnerabilities by repo
SELECT repo, count(*) FROM grype_repo_vulnerabilities
JOIN repos ON grype_repo_vulnerabilities.repo_id = repos.id
GROUP BY repo
ORDER BY count(*) DESC

Trivy vulnerabilities by repo

Vulnerability Count by Repo & Severityโ€‹

These queries break out the count of vulnerabilities across codebase and severity.

-- Count of grype vulnerabilities by repo and severity
SELECT repo, severity, count(*) FROM grype_repo_vulnerabilities
JOIN repos ON grype_repo_vulnerabilities.repo_id = repos.id
GROUP BY repo, severity
ORDER BY count(*) DESC
-- Count of trivy vulnerabilities by repo and severity
SELECT repo, vulnerability_severity, count(*) FROM trivy_repo_vulnerabilities
JOIN repos ON trivy_repo_vulnerabilities.repo_id = repos.id
GROUP BY repo, vulnerability_severity
ORDER BY count(*) DESC

Vulnerability count by repo and severity

Vulnerability Count by Typeโ€‹

Look at the breakdown of vulnerability counts by "type" (package ecosystem).

note

Interestingly, Grype reports more npm vulnerabilities while Trivy reports more gomod vulnerabilities across our repos.

-- Count of trivy vulnerabilities by type
SELECT type, count(*) FROM trivy_repo_vulnerabilities
GROUP BY type
ORDER BY count(*) DESC
-- Count of grype vulnerabilities by type
SELECT type, count(*) FROM grype_repo_vulnerabilities
GROUP BY type
ORDER BY count(*) DESC

Trivy vulnerabilities by type

Most Common Vulnerabilitiesโ€‹

Find which vulnerabilities you're most exposed to by surfacing the most commonly found ones (by CVE ID) in your codebases.

-- Count of trivy vulnerabilities by id
SELECT count(*) vulnerability_id, vulnerability_title, type FROM trivy_repo_vulnerabilities
GROUP BY vulnerability_id, vulnerability_title, type
ORDER BY count(*) DESC
-- Count of grype vulnerabilties by id
SELECT count(*), id, description, type FROM grype_repo_vulnerabilities
GROUP BY id, description, type
ORDER BY count(*) DESC

Additional Exploration

Hopefully these queries and screenshots give a sense of what's possible when it comes to understanding CVEs across your organization using MergeStat SQL. Some additional queries and explorations that could be interesting:

  • Join CVE data with Git activity to order by the recency of commits in code (filter out abandoned codebases where the last commit was over a year ago)
  • Determine if certain teams or projects do a better job at managing CVEs
  • Alert when new CRITICAL vulnerabilities are detected using a direct SQL integration
  • Connect a BI tool directly to the MergeStat PostgreSQL instance to see vulnerability data in a single dashboard
Join our Slack

If this you find this interesting and want to dig deeper on CVE data with us, hop in our community Slack! We're always happy to chat about MergeStat there ๐ŸŽ‰.

note

Today, repo data sources are defined in the MergeStat code. We're working on support for a "bring your own" tool approach that would enable anyone to configure their own scanners or scripts in MergeStat.

Patrick DeVivo

We're excited to announce that the most recent releases of MergeStat now include basic data visualization capabilities - try it out!

Example of a bar chart in the MergeStat UI

We're starting small, with simple support for line charts ๐Ÿ“ˆ and bar charts ๐Ÿ“Š in our SQL execution interface. We've also added a single metric view type which will feed into the dashboarding capabilities we have planned (along with our other chart types).

This has been one of the more frequently requested features from our early users, as it now means you don't have to bring in another BI tool (such as Grafana, Metabase, Superset, etc.) to visualize the data in your MergeStat instance. Support for direct SQL access is not going anywhere however, and nothing prevents more robust data visualizations in other tools.

Example of MergeStat data visualization in Grafana Example of MergeStat data visualization in Grafana

Keep a Lookout for:

  • More chart types, such as scatter plots and pie/donut charts
  • More chart options and customization abilities
  • Saved queries and visualizations for easier reuse
  • Dashboard composition for putting together dynamic, SQL-driven reports on MergeStat data
Join our Slack

Our community Slack is a great place to find help and ask questions. We're always happy to chat about MergeStat there ๐ŸŽ‰!

Patrick DeVivo

Did you know that GitHub maintains a public database of known CVEs and security advisories for open-source codebases? The database is a public Git repository that holds JSON files in OSV format, partitioned by date. This is the data that's displayed on the github.com/advisories page, which also powers Dependabot alerts!

Since it's just a Git repo, we wanted to take it for a spin with MergeStat to see what we could learn applying some SQL to its contents.

Setupโ€‹

We followed the getting started instructions to get a new local instance of MergeStat running with docker-compose. Since this is a public GitHub repo (and we're looking at the data brought in by the GIT_FILES syncer), we don't need to configure any authentication, we can just bring the repo in directly, and sync the file contents:

Screenshot of the MergeStat app having synced the file contents of the GitHub Advisory Database repo

We started by establishing a view over the "raw" file contents of the repo, which extracts some values from the underlying JSON files and parses their file paths:

-- View of all GitHub Advisories in the repo
CREATE OR REPLACE VIEW github_advisories AS (
SELECT
path,
split_part(path, '/', 2) as reviewed,
split_part(path, '/', 3) as year,
split_part(path, '/', 4) as month,
split_part(path, '/', 5) as id,
contents::jsonb->>'summary' as summary,
contents::jsonb->'database_specific'->>'severity' as severity,
a.value->'package'->'name' as affected_name,
a.value->'package'->'ecosystem' as affected_ecosystem
FROM git_files LEFT JOIN LATERAL jsonb_array_elements(contents::jsonb->'affected') a ON true
WHERE path LIKE 'advisories/%.json'
)

This allows us to run much cleaner queries, such as:

SELECT * FROM github_advisories

Screenshot of the MergeStat app running a SQL query to list all advisories

without needing to carry over the parsing and JSON logic in every query we run.

How many advisories are reviewed vs unreviewed?โ€‹

SELECT
count(1) as total,
count(1) FILTER (WHERE reviewed = 'github-reviewed') as reviewed,
count(1) FILTER (WHERE reviewed = 'unreviewed') as unreviewed
FROM github_advisories
  • 201,711 total advisories (at time of writing)
  • 19,078 advisories have been reviewed by GitHub (~9% of total)
  • 182,633 remain unreviewed

(Clearly the GitHub team has quite a bit on their plate ๐Ÿ˜€)

How many advisories exist by ecosystem?โ€‹

Ecosystem here refers to the package registry the advisory was found in. Looks like PyPi has the most and Pub the least. Note that we're excluding results where an affected ecosystem is not listed.

SELECT
affected_ecosystem,
count(*)
FROM github_advisories
WHERE affected_ecosystem IS NOT NULL -- where the affected ecosystem is known
GROUP BY affected_ecosystem
ORDER BY count(*) DESC

Chart showing the number of advisories by ecosystem

How many advisories exist by ecosystem and severity?โ€‹

Severity here is one of CRITICAL, HIGH, MODERATE, and LOW.

SELECT
affected_ecosystem,
severity,
count(*)
FROM github_advisories
WHERE affected_ecosystem IS NOT NULL -- where the affected ecosystem is known
GROUP BY affected_ecosystem, severity
ORDER BY count(*) DESC

Chart showing the number of advisories by ecosystem and severity

Some ecosystems have fewer advisories overall, but a higher percentage of those advisories are CRITICAL.

How many advisories have been published over time?โ€‹

SELECT
extract(year from published) || '-Q' ||extract(quarter from published) as quarter,
count(*)
FROM github_advisories
GROUP by extract(year from published), extract(quarter from published)
ORDER BY extract(year from published) ASC, extract(quarter from published) ASC

Chart showing the number of advisories by publication quarter

Looks like a ton of advisories were published in Q2 2022, making it hard to see overall trends.

What's been the makeup of advisory severity over time?โ€‹

SELECT
extract(year from published) || '-Q' ||extract(quarter from published) as quarter,
severity,
count(*)
FROM github_advisories
GROUP by extract(year from published), extract(quarter from published), severity
ORDER BY extract(year from published) ASC, extract(quarter from published) ASC

Chart showing the number of advisories by publication quarter and severity

Chart showing the number of advisories by publication quarter and severity, 100% stacked With 100% stacking

What's been the makeup of advisory ecosystem over time?โ€‹

SELECT
extract(year from published) || '-Q' ||extract(quarter from published) as quarter,
affected_ecosystem,
count(*)
FROM github_advisories
GROUP by extract(year from published), extract(quarter from published), affected_ecosystem
ORDER BY extract(year from published) ASC, extract(quarter from published) ASC

Chart showing the number of advisories by publication quarter and ecosystem

(Where the ecosystem is known).

What packages have the most advisories?โ€‹

SELECT affected_name, affected_ecosystem, count(*)
FROM github_advisories
WHERE affected_ecosystem IS NOT NULL
GROUP BY affected_name, affected_ecosystem
ORDER BY count(*) DESC

Chart showing the number of advisories by package

Looks like there's a lot going on in tensorflow!

What packages have the most advisories, by ecosystem?โ€‹

SELECT affected_name, affected_ecosystem, count(*)
FROM github_advisories
WHERE affected_ecosystem IS NOT NULL AND affected_ecosystem = 'REPLACE_WITH_ECOSYSTEM'
GROUP BY affected_name, affected_ecosystem
ORDER BY count(*) DESC
LIMIT 10

PyPIโ€‹

Chart showing the number of advisories by package in the PyPI ecosystem

Mavenโ€‹

Chart showing the number of advisories by package in the Maven ecosystem

npmโ€‹

Chart showing the number of advisories by package in the npm ecosystem

Packagistโ€‹

Chart showing the number of advisories by package in the Packagist ecosystem

NuGetโ€‹

Chart showing the number of advisories by package in the NuGet ecosystem

Goโ€‹

Chart showing the number of advisories by package in Go ecosystem

RubyGemsโ€‹

Chart showing the number of advisories by package in RubyGems ecosystem

crates.ioโ€‹

Chart showing the number of advisories by package in crates.io ecosystem

Next Stepsโ€‹

This has been a high level view of all the advisories found in a specific GitHub-maintained public database. To examine the advisories that impact your organization or team, you'd want to join the data in this repository with information about what packages your code brings in - potentially by using SBOMs or even parsing package manifests.

Tools such as Dependabot already do this for the GitHub ecosystem, and automate the maintainence of dependencies as well. There are, however, other databases and ecosystems emerging that track advisories and vulnerabilities. MergeStat supports some of these tools today, and we are working to make it possible for anyone to easily bring the output of their own selection of tools in. We believe the easier it is to access data involved in key aspects of the software-supply-chain, the more secure and the more effective engineering organizations may be.

Join our Slack

Our community Slack is a great place to find help and ask questions. We're always happy to chat about MergeStat there ๐ŸŽ‰!

Patrick DeVivo

Recently, MergeStat added support for collecting data from GitHub Actions. We wanted a way to start asking questions about our CI pipelines, and very soon we were able to leverage MergeStat to surface useful results.

Finding Our Most Expensive CI Pipelinesโ€‹

Last year we received a GitHub bill that surprised us. We had an expensive charge related to GitHub Actions minutes, even though most of our repos are public (Actions usage is free for public repos). We ended up finding a couple of experimental workflows in private repos that were the culprits of the higher-than-usual costs.

To find these, we exported our raw Actions usage data into a spreadsheet, aggregated the minutes, and ordered by the most expensive repos. This wasn't too difficult, but it made us think about how valuable it could be to always have this data on hand, with the ability to query it ad-hoc (vs needing to run an export, load a spreadsheet and run some formulas every time).

Now that we have GitHub Actions data syncing with MergeStat, we're able to do this:

-- find our longest running CI jobs
SELECT
EXTRACT(EPOCH FROM (public.github_actions_workflow_runs.updated_at - public.github_actions_workflow_runs.run_started_at))::integer/60 AS minutes_to_run,
public.repos.repo,
public.github_actions_workflow_runs.*
FROM public.github_actions_workflow_runs
INNER JOIN public.repos ON public.github_actions_workflow_runs.repo_id = public.repos.id
ORDER BY 1 DESC

Screenshot of SQL query for finding long running GitHub Actions in the MergeStat app

Improving DevEx by Finding Long Running Testsโ€‹

In a very related use case, a partner reached out asking how to use MergeStat to query for long running tests. Long running tests can be a significant bottleneck in a software-delivery pipeline, especially at scale. This impacts developer experience and the rate at which teams can deliver value to production.

We were able to tweak the query above to answer this question. In short, we filtered out workflow runs that had a name that included the string test, which was good enough for the situation at hand:

SELECT 
EXTRACT(EPOCH FROM (public.github_actions_workflow_runs.updated_at - public.github_actions_workflow_runs.run_started_at))::integer/60 AS minutes_to_run,
public.repos.repo,
public.github_actions_workflow_runs.*
FROM public.github_actions_workflow_runs
INNER JOIN public.repos ON public.github_actions_workflow_runs.repo_id = public.repos.id
WHERE public.github_actions_workflow_runs.name ilike '%test%'
ORDER BY 1 DESC

Next Upโ€‹

These two examples hopefully convey the value of having this type of CI/CD data on hand and accessible with SQL. Since this data can sit next to pull requests, commits, code, issues and more, we can augment these queries with additional dimensions to get deeper insights into engineering operations overall.

In addition, we're working on some exciting features that will make accessing and using this data much easier. In particular, saved queries, charts, dashboards, reports and alerts will make it possible to use this data more effectively.

  • Visualize which repos or teams are using the most CI minutes.
  • Send a Slack alert when a CI run takes longer than expected (configurable).
  • Track improvements in CI runtimes over different periods and teams, use it to celebrate or communicate up.

Regardless, MergeStat's mission continues to be in service of data agility for software engineering. Check us out!

Join our Slack

Our community Slack is a great place to find help and ask questions. We're always happy to chat about MergeStat there ๐ŸŽ‰!

Patrick DeVivo

The GIF on our landing page shows a SQL query executing in a MergeStat application:

GIF showing a query surfacing Go mod versions

If you look closely, you'll notice that the query has something to do with go.mod files. In particular, it's this query:

-- Go version counts across all repos
SELECT
SUBSTRING(git_files.contents FROM 'go ([0-9]+.[0-9]+)') AS dependencies_go_version,
COUNT(1) AS version_count
FROM git_files
INNER JOIN repos ON repos.id = git_files.repo_id
WHERE git_files.path LIKE '%go.mod' AND SUBSTRING(git_files.contents FROM 'go ([0-9]+.[0-9]+)') IS NOT NULL
GROUP BY dependencies_go_version
ORDER BY version_count DESC

which parses out the go directive in any go.mod file it finds, looking for the declared Go version.

A go directive indicates that a module was written assuming the semantics of a given version of Go. The version must be a valid Go release version: a positive integer followed by a dot and a non-negative integer (for example, 1.9, 1.14).

Why?โ€‹

Cool - but how is this useful? The value we are trying to convey in this query is MergeStat's ability to surface data across many Git repositories. This in particular should resonate with anyone who's worked on a team responsible for lots of codebases across an organization: DevEx, DevSecOps, Platform, etc.

Aggregating Go versions across many repos is useful in ensuring a consistent experience for Go developers. This may be important for an internal DevEx or Platform team to understand, or for any one responsible for the maintenance of many open-source, public Go projects.

It could serve as a proxy measure for how "up to date" codebases are, whether they are able to support the latest features of the language. For instance, Generics were introduced in 1.18, and it may be important to know how much of your Go source code is able to make use of them by looking at go.mod files.

Looking at Public HashiCorp go.mod Filesโ€‹

Let's take a look at the go.mod files in some public Git repos. HashiCorp is famously a large Go shop, and many of their core projects are in Go - so let's take a look at all their public repos!

Here's how I used MergeStat to do so:

Run MergeStatโ€‹

First, I grabbed a server from our friends at Equinix Metal. I intend to use the MergeStat docker-compose set-up, outlined here.

I ssh into my new server and run the following:

git clone https://github.com/mergestat/mergestat
cd mergestat
docker-compose up

This brings up an instance of MergeStat on port :3300 on the IP of my new server, where I can login with the default credentials postgres and password.

Setup Repos & Syncsโ€‹

Next, I add a GitHub PAT so that I can:

  1. Add a repo auto import for the hashicorp GitHub organization
  2. Use the GITHUB_REPO_METADATA sync type (the GIT_FILES sync does not require GitHub authentication, since it uses the native Git protocol)

Screenshot of adding a repo auto import

I make sure to enable the GitHub Repo Metadata and Git Files sync types.

Screenshot of the repo auto import once added

Now, the file contents and metadata from the GitHub API should begin syncing for all public HashiCorp repos ๐ŸŽ‰. I can run this query to keep track of the initial sync:

SELECT count(*) FROM mergestat.repo_syncs WHERE last_completed_repo_sync_queue_id IS NULL

Once the result is 0, I'll know that the first run for all the syncs I've defined are complete.

Executing Queriesโ€‹

Once the initial data sync is complete, I can start executing some queries. Let's start by identifying how many of the 977 repos are identified as Go repos (by GitHub):

SELECT count(*), primary_language FROM github_repo_info
GROUP BY primary_language
ORDER BY count(*) DESC

Chart of HashiCorp repos by language

Looks like 431 are picked up as Go codebases.

Next, let's run the original query from above, but with a small amendment. I'll change the LIKE '%go.mod' to LIKE 'go.mod', to only identify go.mod files in the root of a repo. This avoids picking up vendored Go modules.

HashiCorp Go versions

And there you have it! Looks like most public HashiCorp repos are on 1.18.

You may notice that the sum of all repos in this query is 390, not 431. This is likely because not all Go repos have a go.mod file.

Operationalize Itโ€‹

Because MergeStat makes use of PostgreSQL, queries like this can be hooked up to BI tools and internal dashboards. This could be a useful way to track a migration effort, for instance, or alert on when a repo begins using a "non-standard" version of Go for your organization.

Further, these queries data can be augmented with commit and team data, to add additional dimensions.

Join our Slack

Our community Slack is a great place to find help and ask questions. We're always happy to chat about MergeStat there ๐ŸŽ‰!

Patrick DeVivo

Recently, I came across this tweet from Nicolas Carlo:

Nicolas Carlo tweet about finding hotspots in a git repo

Finding hotspots in a (git) codebase can be surfaced with the following:

git log --format=format: --name-only --since=12.month \
| egrep -v '^$' \
| sort \
| uniq -c \
| sort -nr \
| head -50

This defines hotspots as the files most frequently modified in the last year (by number of commits).

This bash script looks a lot like what both MergeStat and MergeStat Lite can surface, but using SQL ๐ŸŽ‰!

MergeStat Exampleโ€‹

MergeStat can be used to surface this list as well:

select file_path, count(*)
from git_commits join git_commit_stats on (git_commits.repo_id = git_commit_stats.repo_id and git_commits.hash = git_commit_stats.commit_hash)
join repos on git_commits.repo_id = repos.id
where repo like '%mergestat/mergestat' -- limit to a specific repo
and git_commits.parents < 2 -- ignore merge commits
and author_when > now() - '1 year'::interval
group by file_path
order by count(*) desc
limit 50

Screenshot of MergeStat Example

MergeStat Lite Exampleโ€‹

MergeStat Lite (our CLI) can be run against a git repo on disk to surface the same set of file paths:

select
file_path, count(*)
from commits, stats('', commits.hash)
where commits.author_when > date('now', '-12 month')
and commits.parents < 2 -- ignore merge commits
group by file_path
order by count(*) desc
limit 50

Screenshot of MergeStat Lite Example

Why bother?โ€‹

As Nicolas Carlo points out, identifying hotspots in a codebase is an effective way to determine which files are worth examining as candidates for a refactor.

The SQL queries above can be modified to better suit your needs. For example:

  • Filter for particular file types by extension (maybe you only care about hotspots in .go files, for example)
  • Filter out particular directories
  • Modify the time frame
  • Surface hotspots across multiple repositories
  • Filter hotspots based on authors